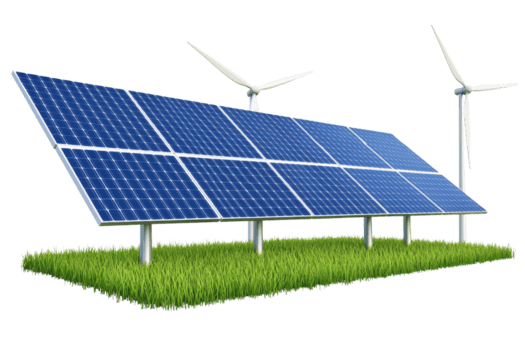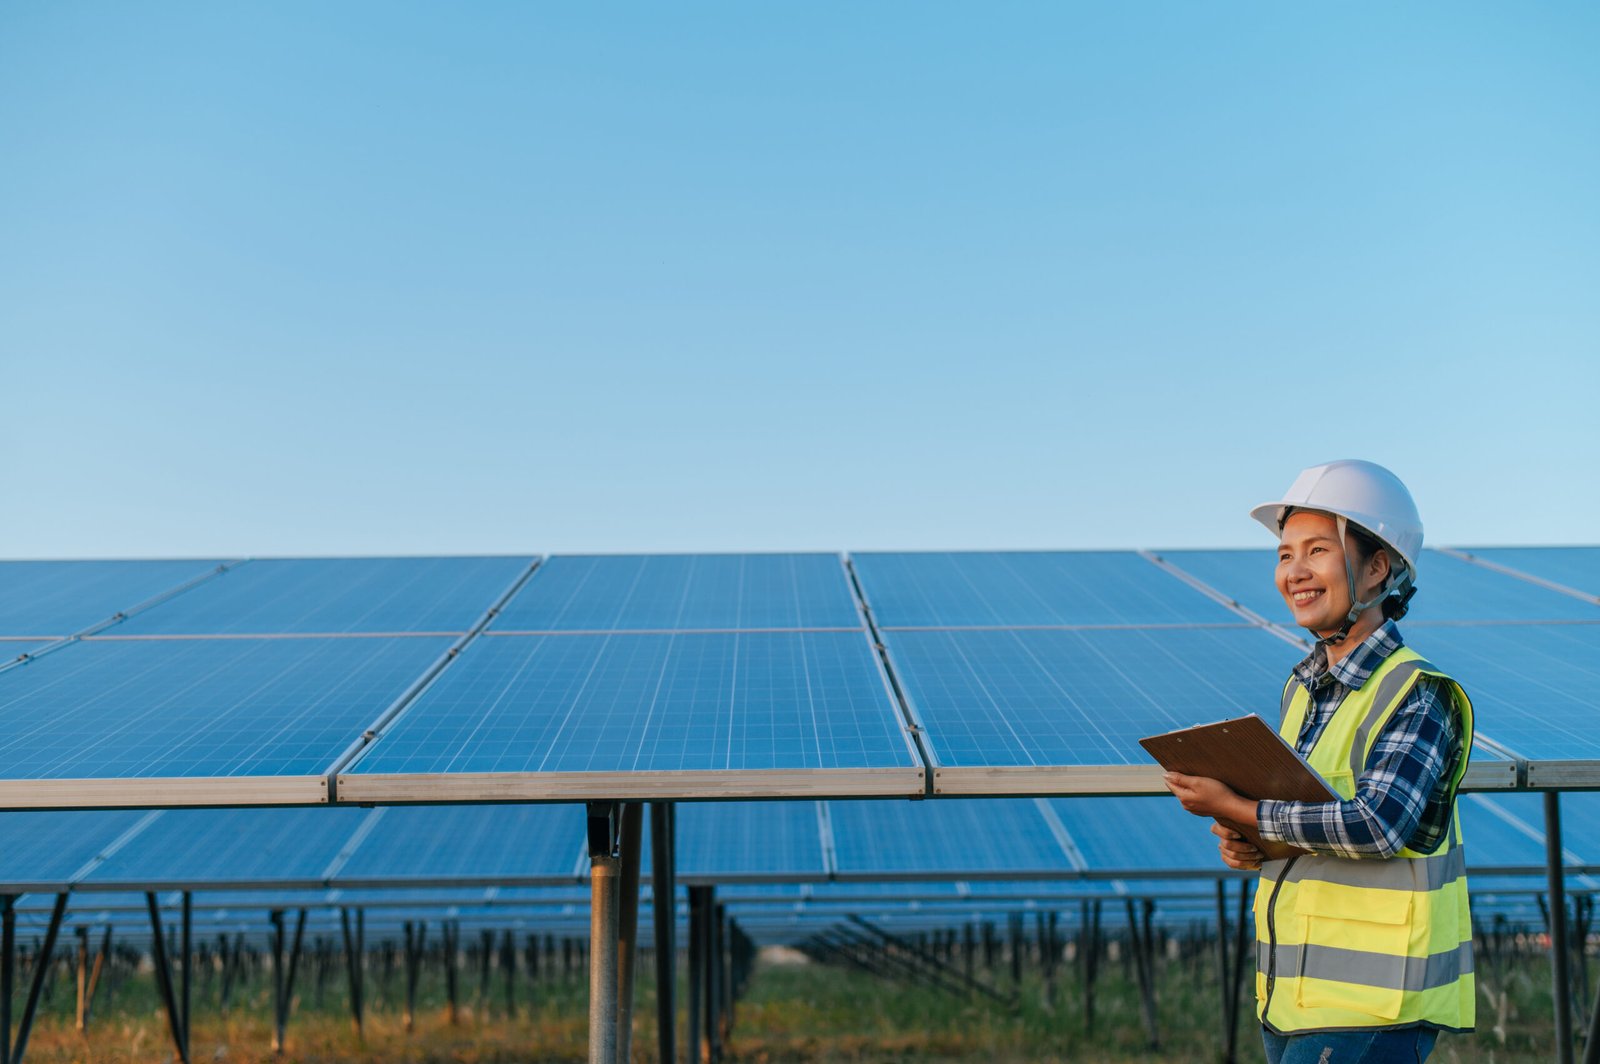
The global energy landscape is experiencing a profound transformation driven by climate change, energy security, and rising electricity demands, with solar energy emerging as a key solution for sustainable development. Once viewed as an alternative source, solar power is now a rapidly growing segment of the energy market, bolstered by declining costs, favorable government policies, and increasing corporate sustainability commitments.
Table of Contents
By 2026, the solar industry is anticipated to become central to the renewable energy sector, with nations enhancing clean energy strategies and investing in solar infrastructure and innovations such as energy storage and smart grid systems. This shift offers significant opportunities for governments, utilities, industrial consumers, investors, and renewable energy developers, marking the solar industry’s evolution towards establishing a clean, reliable, and economically viable energy economy.
Global Solar Industry Growth
The global solar industry has seen remarkable growth, establishing solar power as a key technology in the energy sector by 2026. Contributing factors include rising electricity demand, declining costs, government incentives, and corporate commitments to sustainability. In 2024, approximately 597 GW of new solar capacity was installed, pushing total global installations beyond 2 TW.
Projections indicate that solar will account for nearly 80% of renewable electricity capacity growth by 2030, with annual installations expected to be around 540 GW. The market for solar energy is set to expand from $137 billion in 2025 to over $313 billion by 2032. This growth is driven by falling module prices, increased demand, supportive policies, and technological innovation, positioning solar as a crucial and cost-effective energy source worldwide.
Record Growth of the Global Solar Industry
Over the last decade, the solar industry has seen significant growth, with global solar capacity reaching over 2.1–2.2 terawatts (TW) by the end of 2024. This expansion has been marked by remarkable installation rates, with projections indicating that in 2025, around 655 gigawatts (GW) of new solar installations would occur—one of the highest annual additions recorded. By the end of 2024, total global solar photovoltaic capacity was approximately 2,247 GW, having nearly doubled in just a few years.
A notable record of 602 GW of new solar capacity was added in 2024. This momentum continued into 2025, with 380 GW of new capacity installed in the first half alone, reflecting a 64% increase compared to the same timeframe in 2024. Such rapid deployment solidifies solar power’s status as one of the fastest-growing energy sources in history.
Global Solar Installations in 2026
Market forecasts from BloombergNEF and energy analysts suggest that approximately 649 gigawatts (GW) of new solar capacity is projected to be installed globally in 2026. This estimate indicates a slight decline from the anticipated 655 GW in 2025, translating to a decrease of less than 1% year-on-year. Nonetheless, the solar market remains robust; the predicted 649 GW represents one of the largest annual increments of power capacity recorded in the energy sector.
To contextualize this figure, 649 GW could power hundreds of millions of homes and exceeds the total global solar capacity installed prior to 2015 in a single year. Solar energy is expected to continue being the predominant source of new renewable energy capacity additions globally.
Analysts view the slight reduction in installation forecasts for 2026 as a normal market stabilization following years of extraordinary growth, especially considering that 2025 marked one of the peak years for solar installations. Installing 649 GW of solar capacity equates to the installation of over 1.5 million solar panels daily, showcasing the increasing significance of solar energy in the global electricity framework. Overall, despite the minor decrease, the market outlook for solar energy remains exceptionally strong, highlighting its vital role in future energy systems.
Key Solar Industry Trends in 2026
The solar industry is evolving rapidly as global energy demand increases and governments push toward decarbonization. By 2026, solar power is not only expanding in capacity but also transforming through new technologies, business models, and integration with energy storage systems. These developments are reshaping how electricity is generated, distributed, and consumed across industries and utilities.
Below are the key solar industry trends shaping the global market in 2026.
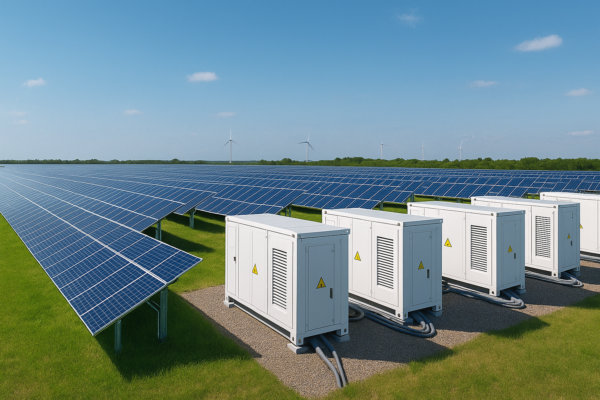
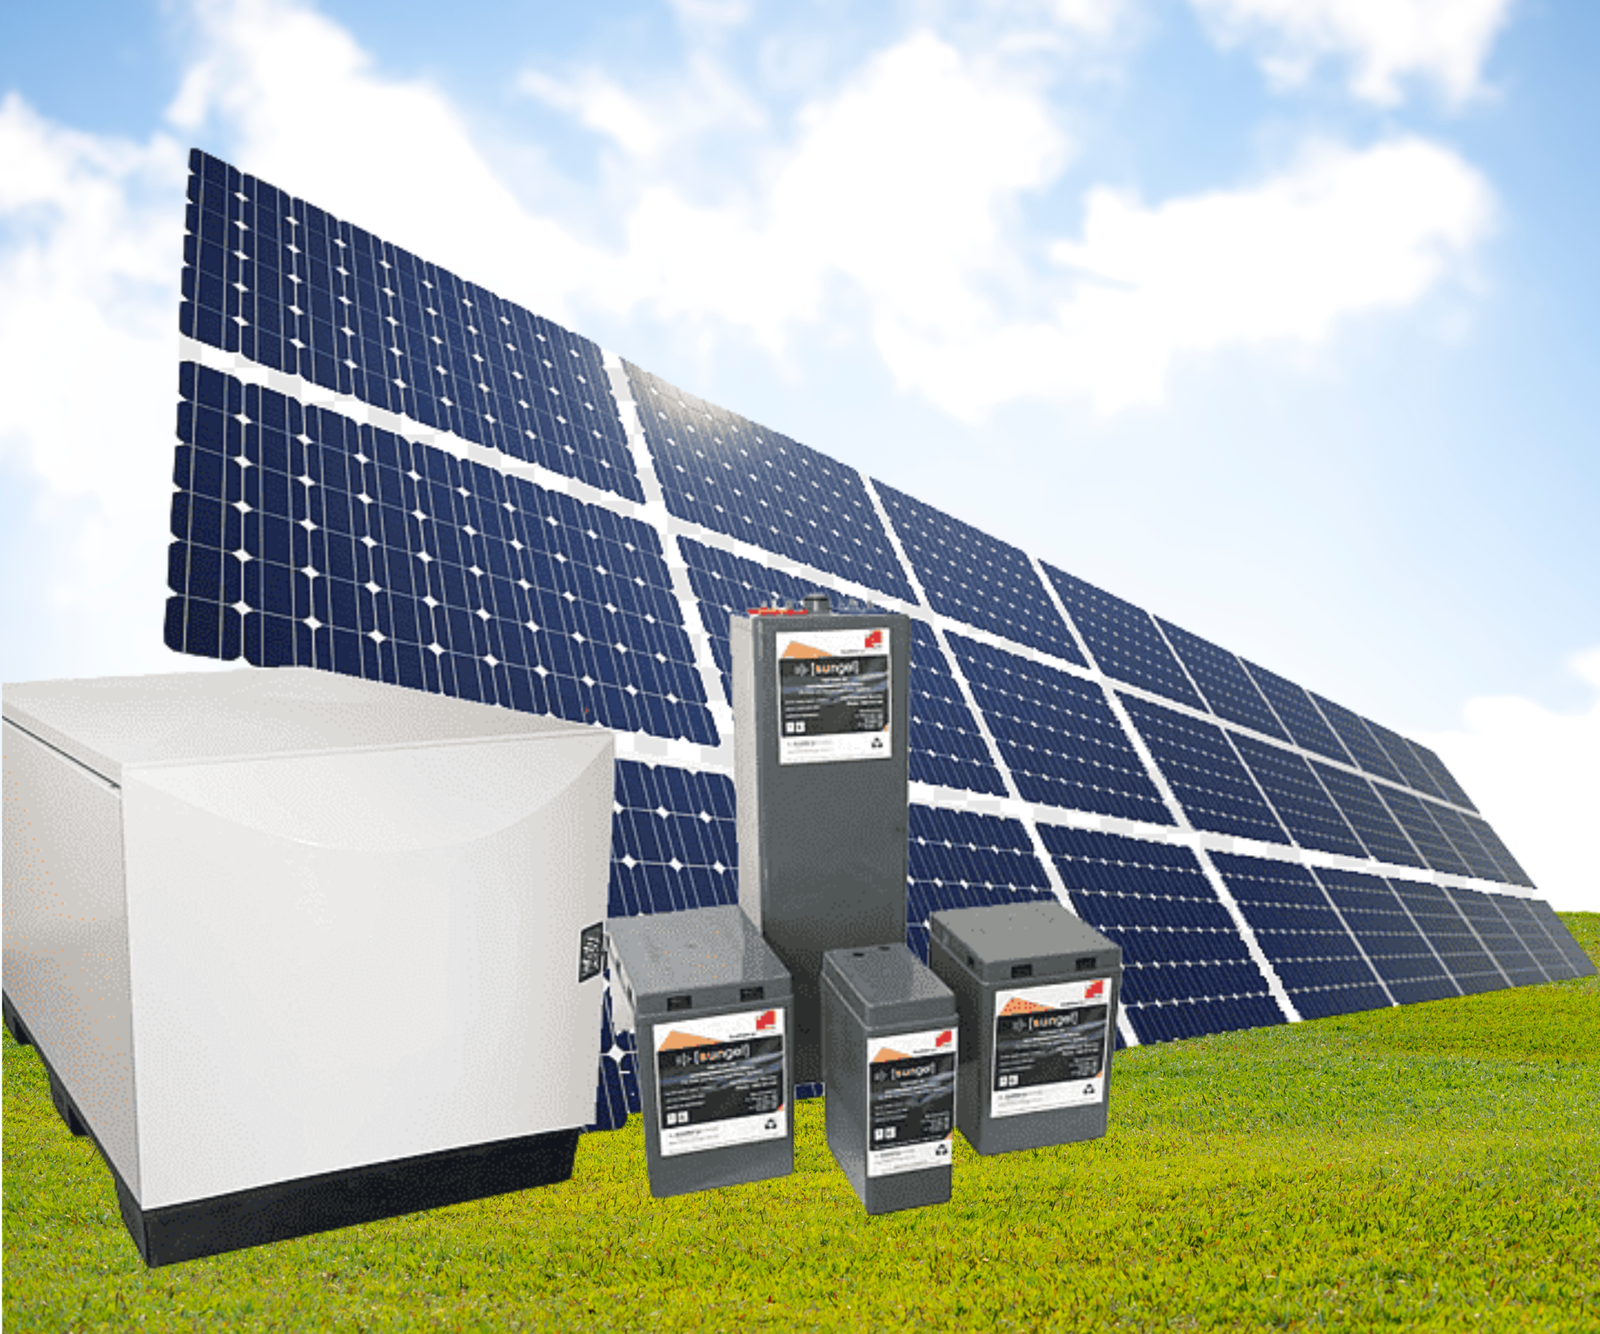
1. Solar + Battery Energy Storage Systems (BESS)
One of the most significant trends in the solar industry is the integration of solar power with battery energy storage systems. This integration addresses the intermittency of solar generation, which primarily produces electricity during daylight hours. By storing excess solar energy for use during peak demand periods or at night, battery storage enhances grid stability and reliability.
Developers around the world are increasingly focusing on solar-plus-storage projects, driven by the growing electricity demand from sectors such as data centers and digital infrastructure. The key benefits of solar-plus-storage include a reliable round-the-clock renewable power supply, reduced grid dependency, improved peak load management, and the potential for higher project revenue through energy arbitrage.
As battery prices continue to decline, hybrid solar-storage plants are gaining traction and are becoming the standard solution for large renewable energy projects. Furthermore, the anticipated growth of distributed and long-duration storage technologies is expected to facilitate the next phase of solar deployment, making solar-storage systems the standard model for utility-scale renewable initiatives.
2. Growth of Distributed Solar Systems
Distributed solar systems, particularly rooftop installations on homes, factories, and commercial buildings, are experiencing rapid growth in global markets. This surge is driven by rising electricity prices and supportive government policies. Distributed solar systems mitigate transmission losses by generating electricity close to its point of consumption. Major segments of distributed solar include residential rooftop solar, commercial and industrial installations, agricultural solar systems, and community solar programs.
For industries, rooftop solar installations not only help in significantly reducing electricity costs but also enhance sustainability performance. The expansion of distributed solar is evident in both developed and emerging markets, with its adoption accelerating globally due to financial incentives and the need for improved sustainability measures.
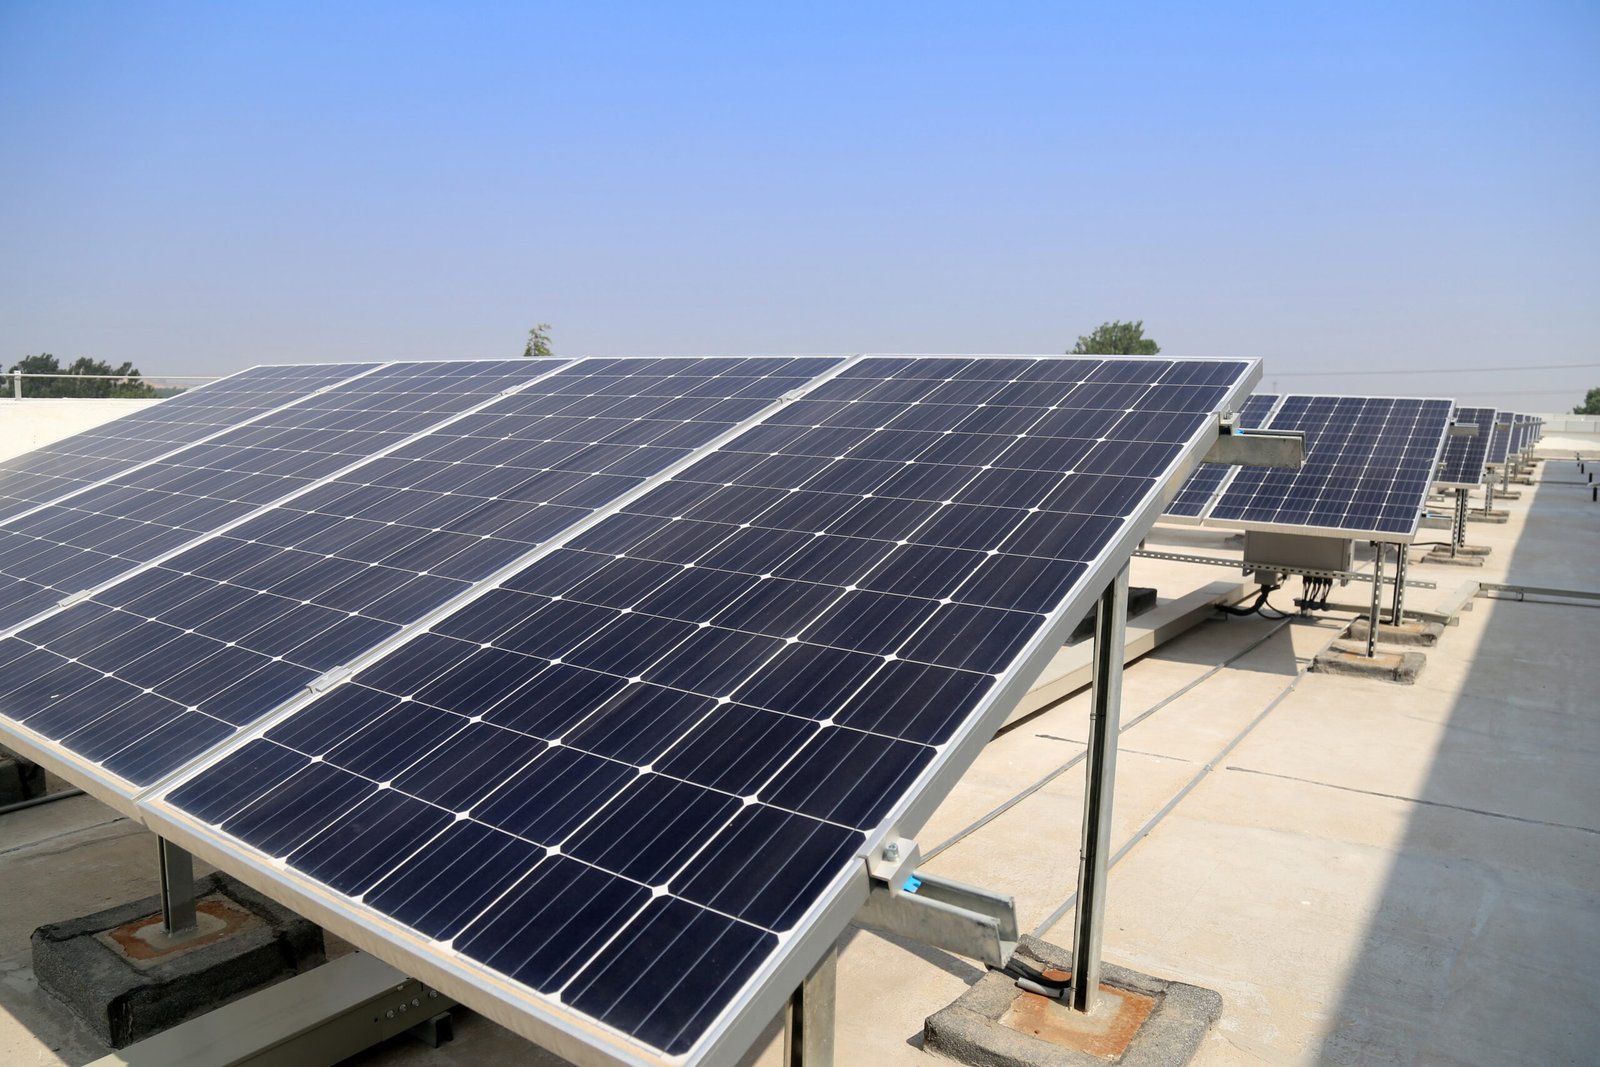
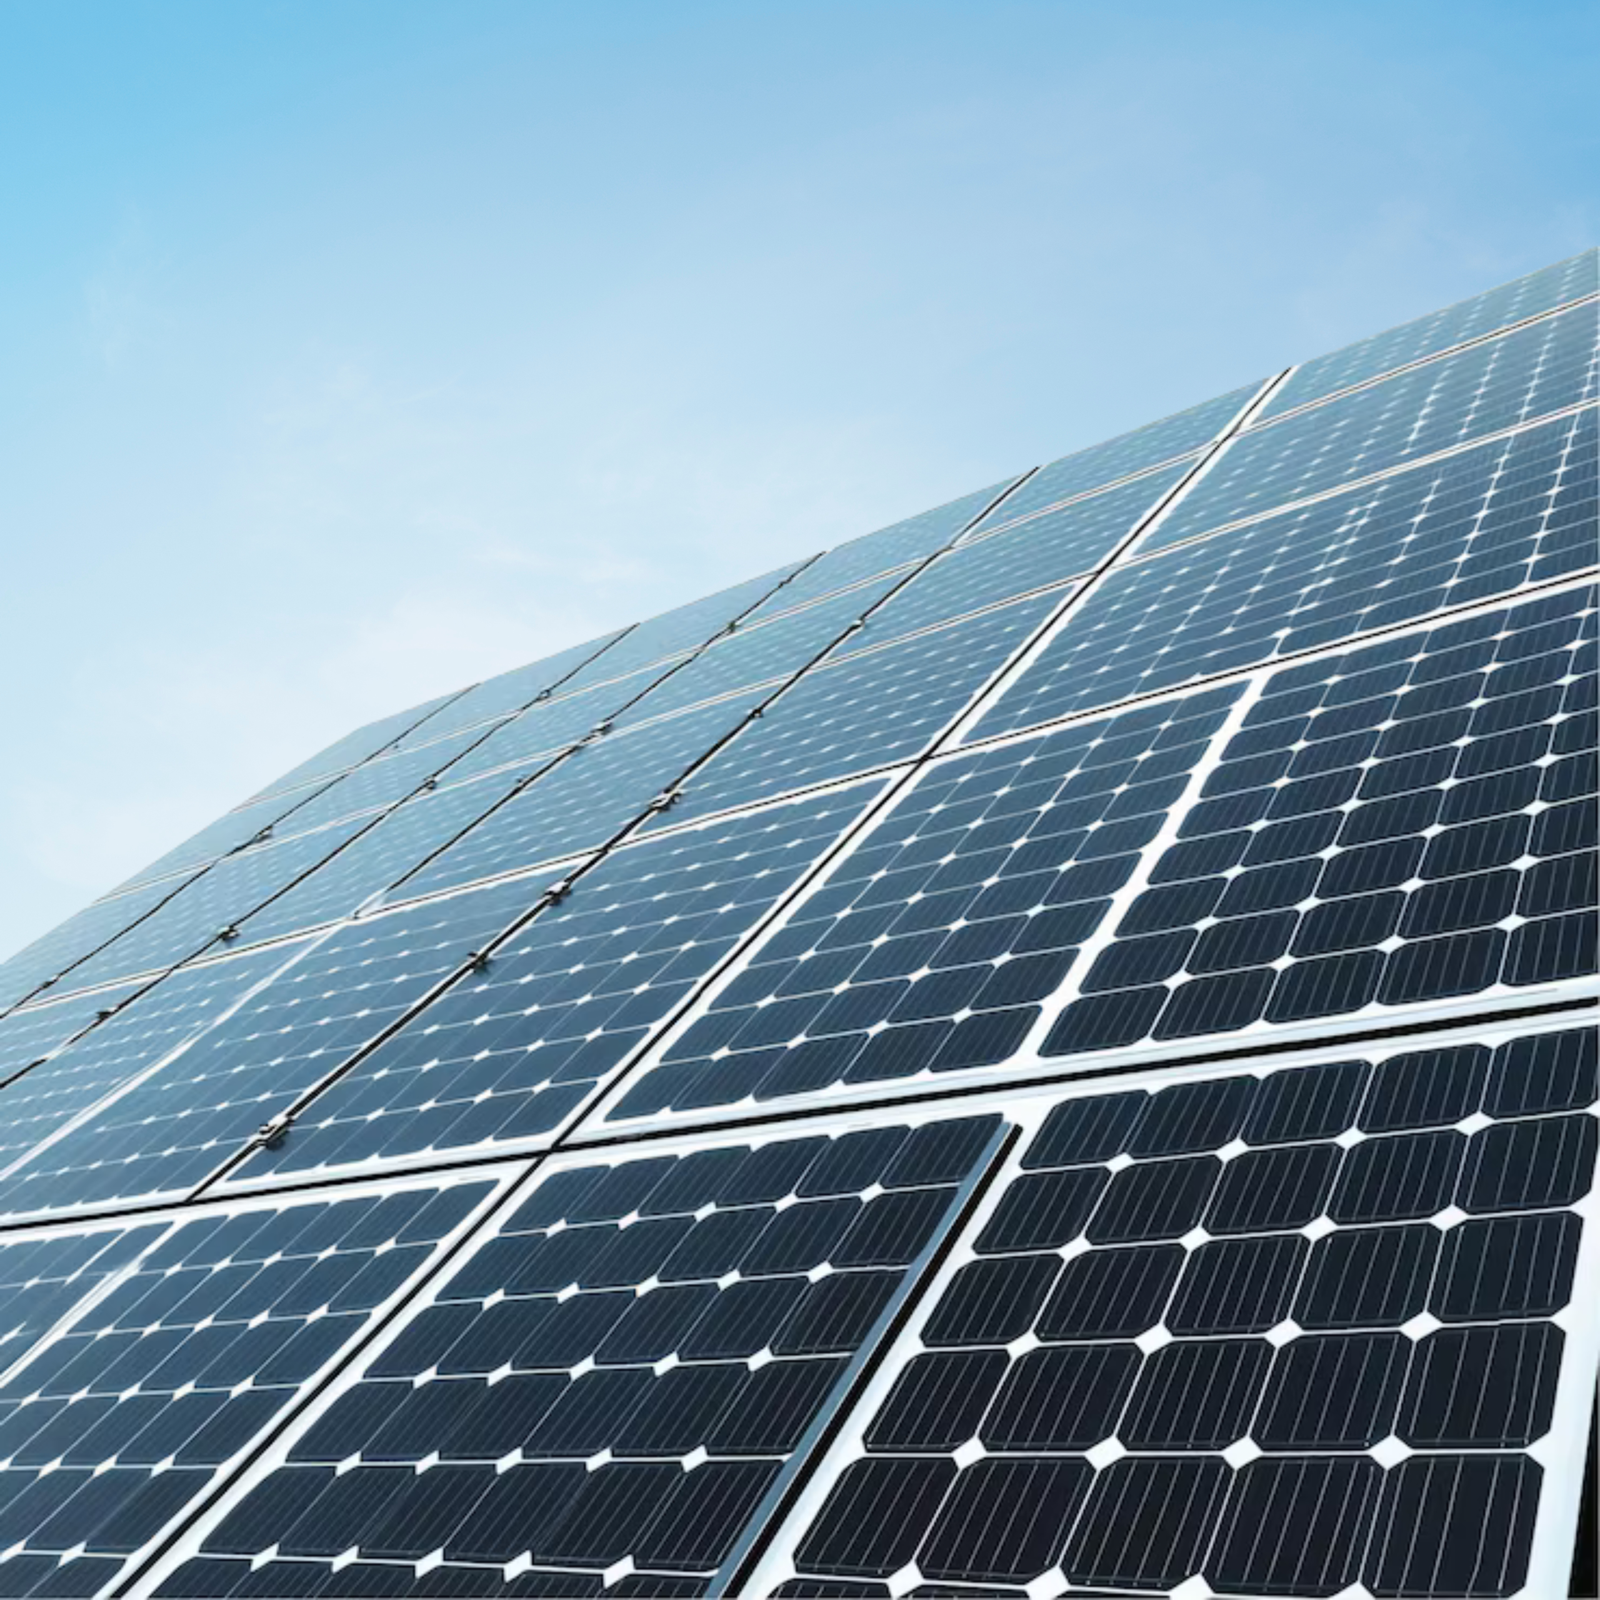
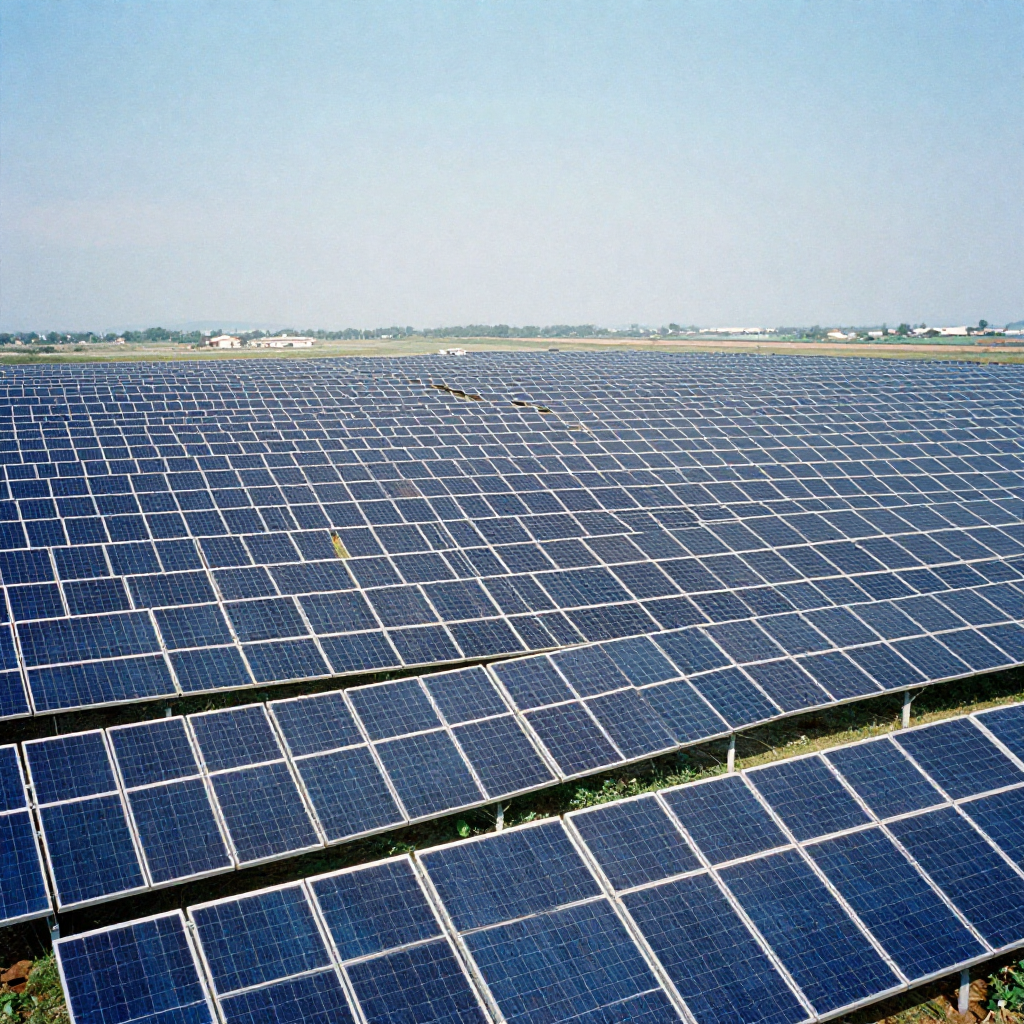
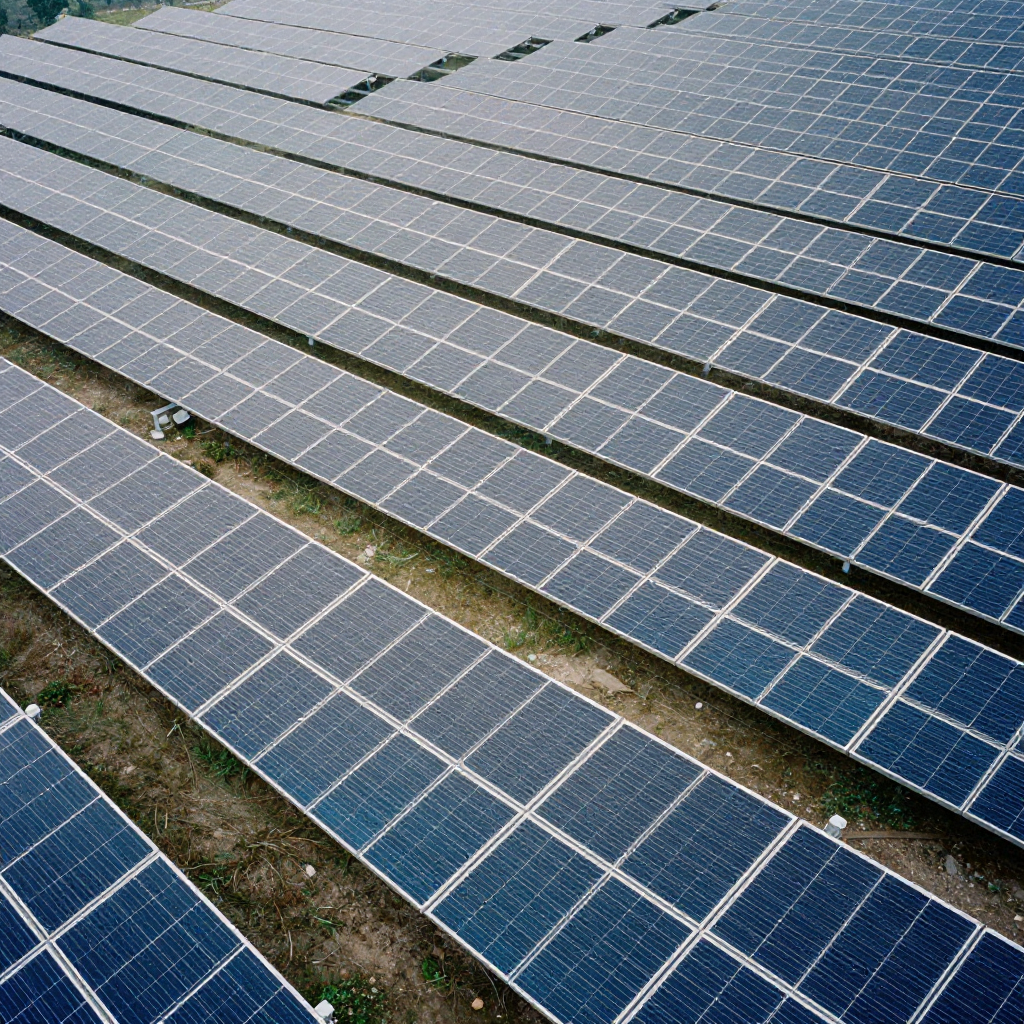
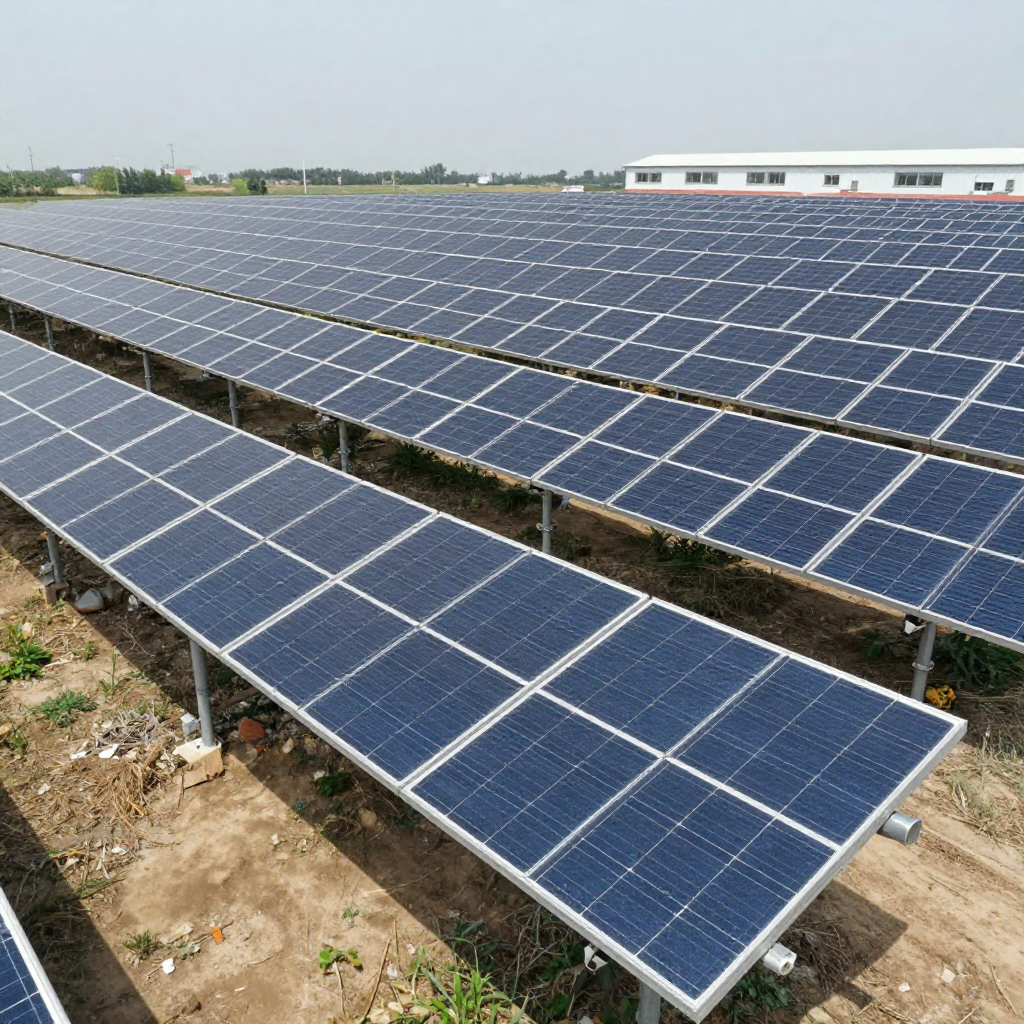
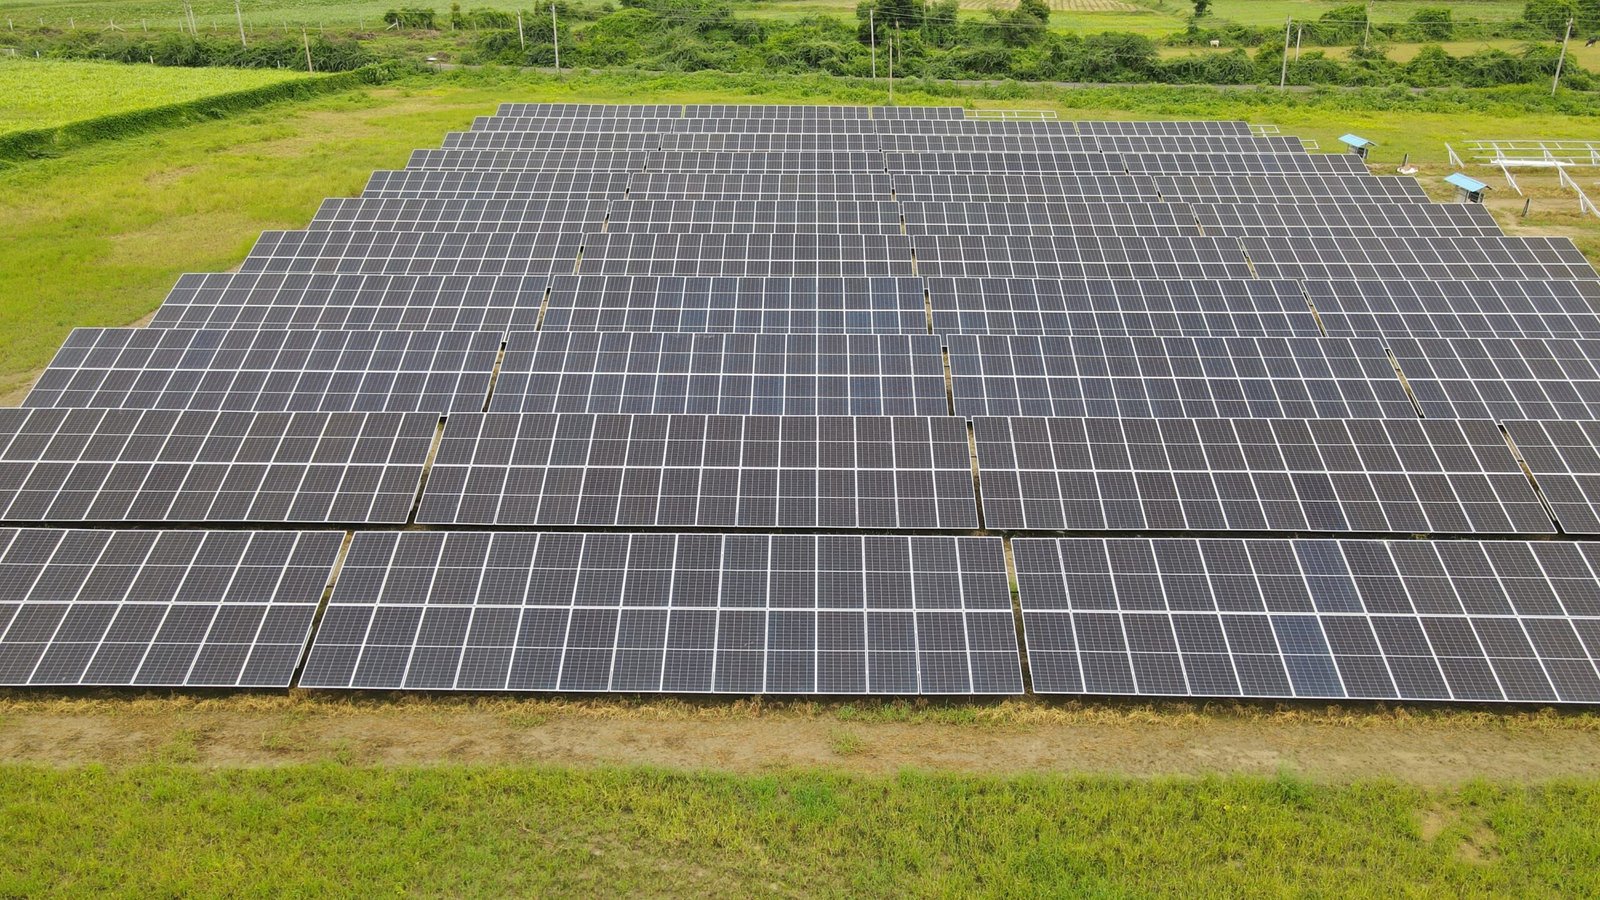
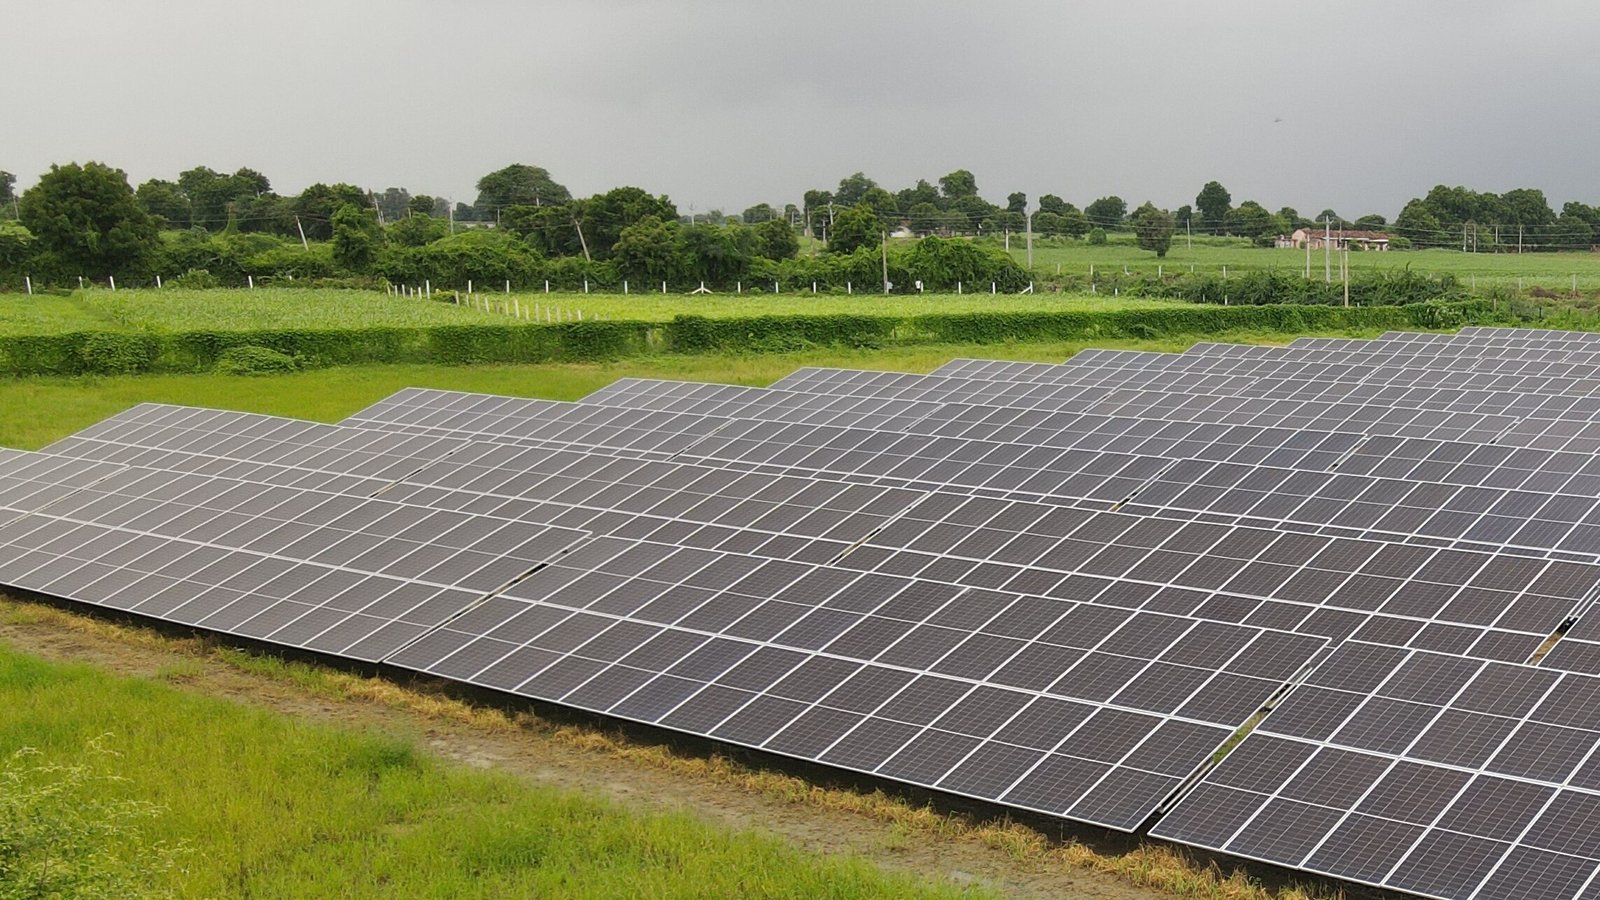
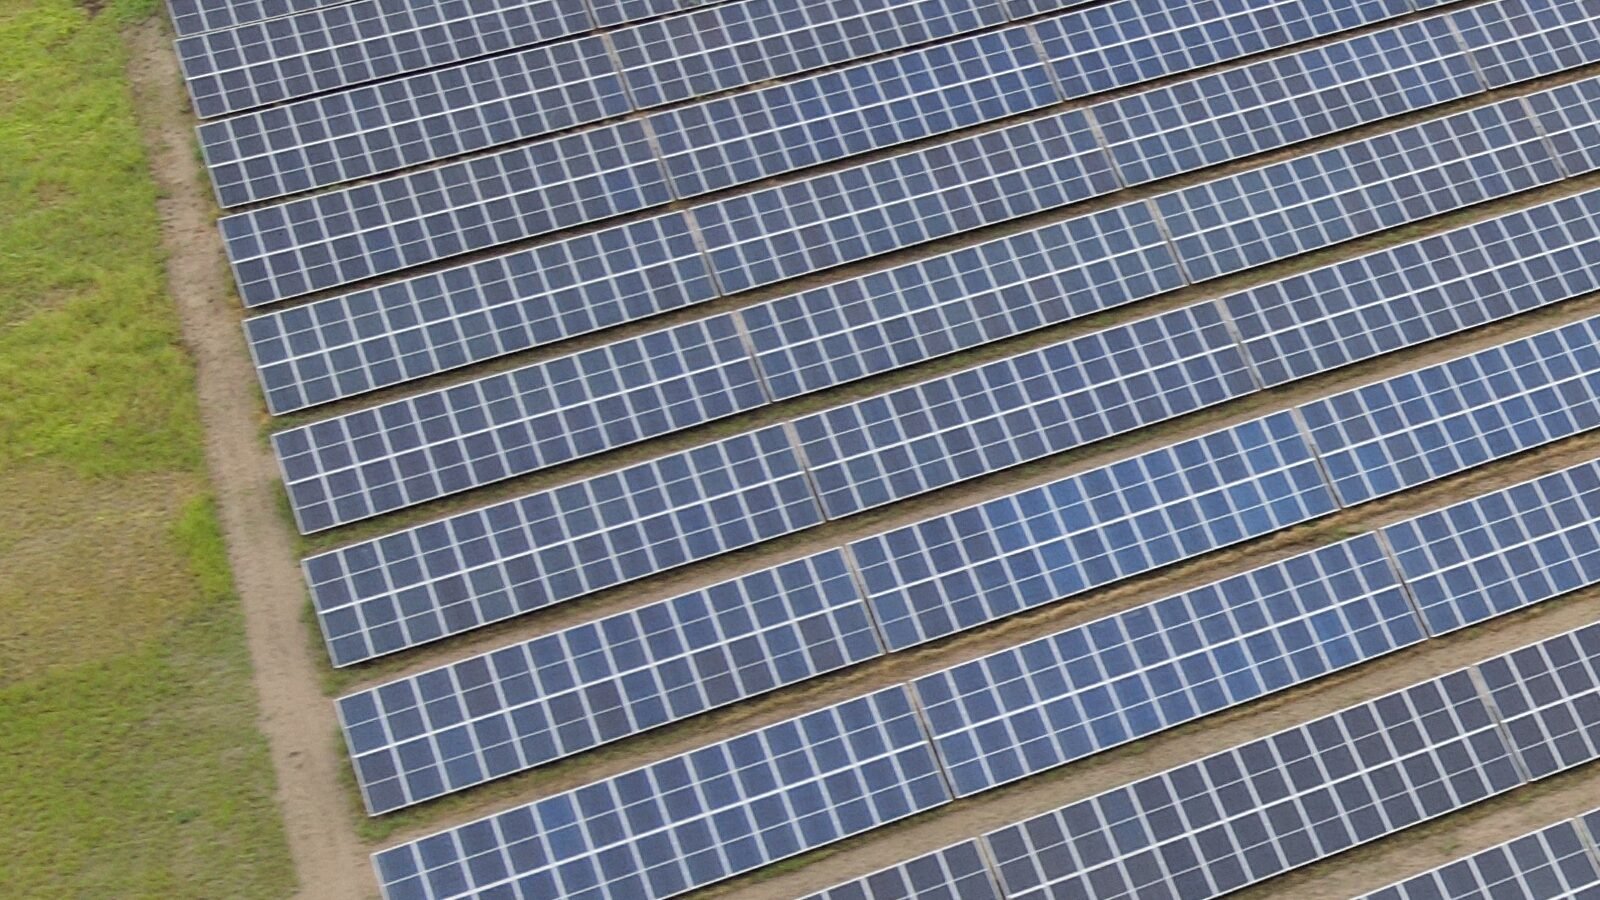
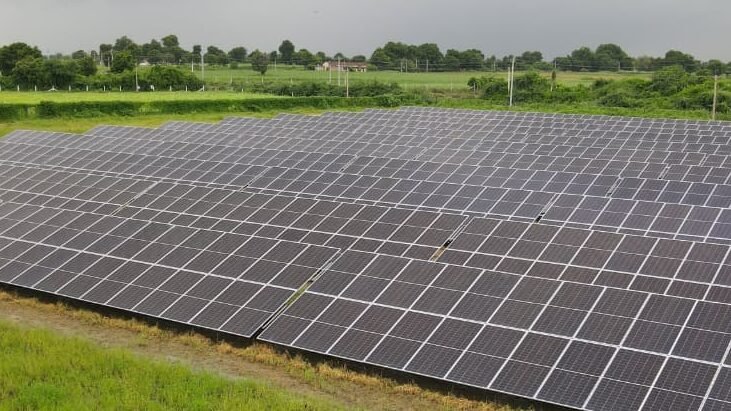
3. Utility-Scale Solar Parks Expansion
Large solar parks are prominently increasing global solar capacity, primarily through utility-scale solar plants that can generate significant amounts of electricity, often ranging from hundreds to thousands of megawatts, and directly supply power to national grids. The benefits of utility-scale solar operations include a lower cost per unit of electricity due to economies of scale, the establishment of long-term power purchase agreements (PPAs), and a more efficient integration with energy storage systems and existing grid infrastructure.
In light of these advantages, governments worldwide are committing substantial investments into solar parks and renewable energy zones to facilitate the rapid deployment of large-scale solar energy solutions. The continued development and expansion of these utility-scale solar plants are essential for meeting rising energy demands and supporting the transition to renewable energy sources.
4. High-Efficiency Solar Panel Technologies
Technological innovation is greatly enhancing the efficiency of solar panels through advancements in photovoltaic technologies. Notable innovations include perovskite-based solar cells and tandem cell structures that achieve efficiencies ranging from 24% to 28%, surpassing traditional silicon panels. These advanced technologies not only improve energy generation but also lower installation costs.
Additional innovations such as AI-based solar monitoring systems, smart inverters, and flexible lightweight solar modules contribute further to the cost-effectiveness and efficiency of solar power. The development of emerging technologies like TOPCon and heterojunction cells, along with AI systems for performance optimization, continue to elevate the power output and lower the levelized cost of energy for solar systems.
5. Bifacial Solar Panels Becoming Mainstream
Bifacial solar panels are gaining traction in large-scale solar projects due to their ability to generate electricity from both sides, capturing reflected sunlight from the ground. This dual-sided technology can enhance energy generation by 10–20% compared to traditional monofacial panels, which makes them particularly suitable for utility-scale solar farms.
The bifacial solar market is anticipated to experience significant growth over the next decade, driven by higher efficiency and decreasing costs. As such, bifacial modules are increasingly becoming the preferred choice for large solar installations, with studies confirming their superior power generation capabilities. Overall, the adoption of bifacial solar panels is expected to dominate the landscape of large solar energy solutions in the coming years.
6. Growth of Domestic Solar Manufacturing
Countries worldwide are enhancing their domestic solar manufacturing capabilities to lessen import dependence and ensure robust supply chains. Policy initiatives and incentives are fostering the creation of local manufacturing ecosystems for solar modules, cells, wafers, and polysilicon. Specific measures include local content requirements for solar projects to bolster domestic manufacturing growth, which is anticipated to result in new investment prospects in solar manufacturing infrastructure. This trend aims to strengthen supply chain resilience and creates demand for domestic production facilities by mandating the use of locally manufactured components in solar projects.
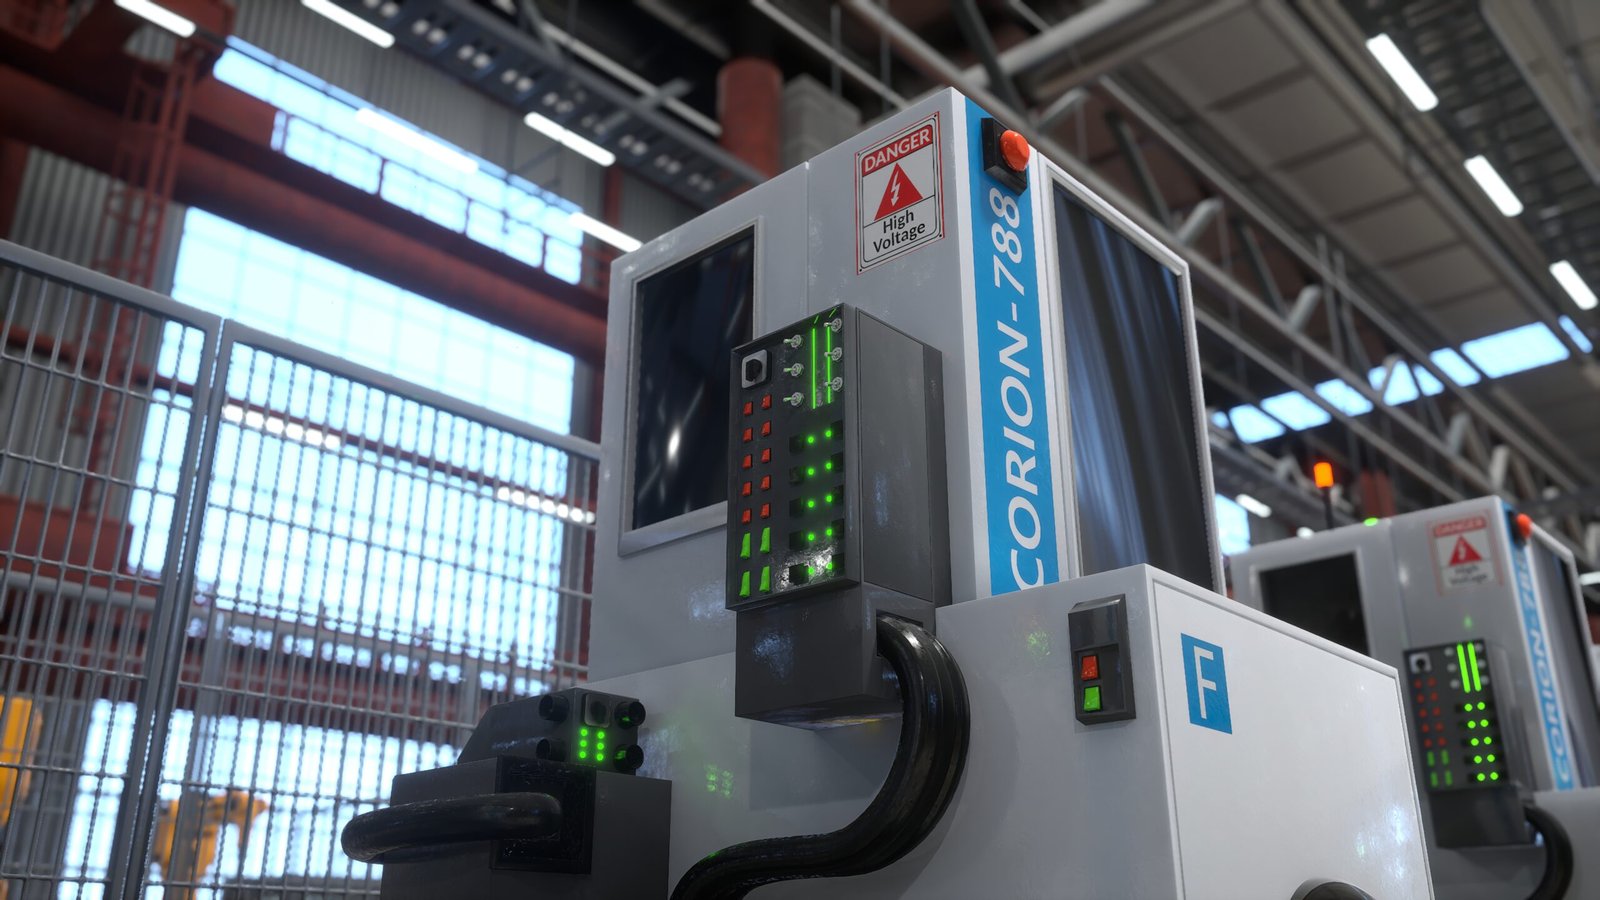
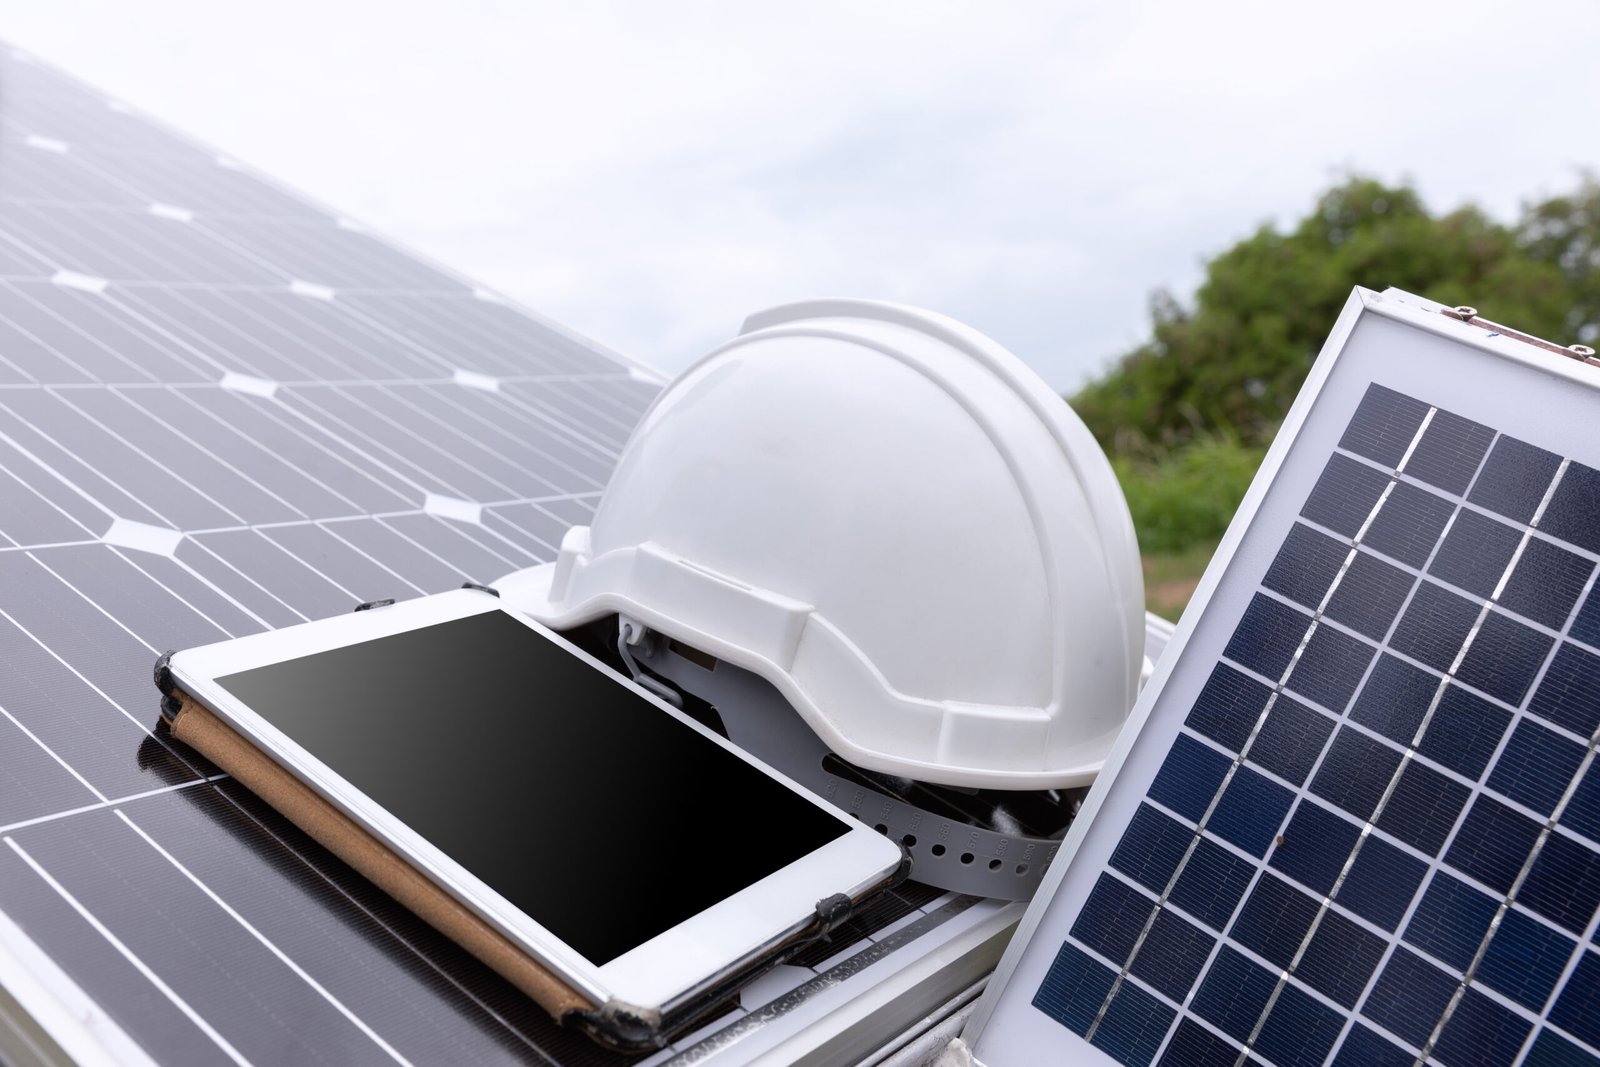
7. Digitalization and Smart Solar Monitoring
Digital technologies are significantly enhancing solar plant operations through the integration of artificial intelligence, IoT sensors, and advanced data analytics. These technologies enable solar plant operators to monitor performance in real time, leading to improved efficiency and reliability in both utility-scale and distributed solar projects. Key features of smart monitoring systems include predictive maintenance, early detection of system faults, and optimization of energy production, all contributing to reduced operational costs. Overall, digitalization empowers solar developers to maximize plant efficiency while ensuring better management of solar assets.
Technology Advancements in Solar Energy
Technological innovation has become one of the most important drivers behind the rapid expansion of the solar industry. Over the past decade, advancements in solar technologies have significantly improved the efficiency, reliability, and affordability of solar energy systems. These developments have allowed the solar industry to evolve from an emerging renewable technology into a major contributor to the global electricity mix. Improvements in photovoltaic (PV) technology, energy storage systems, and digital monitoring tools have made solar energy increasingly competitive with conventional electricity sources, strengthening the position of the solar industry within global energy infrastructure.
These innovations are not only accelerating the transition toward renewable energy but are also enhancing electricity generation, reducing installation costs, and improving the long-term performance of solar projects. As a result, technological progress is reshaping how solar power plants are designed, built, and operated. The solar industry is therefore experiencing a transformation where advanced technologies enable higher productivity, better system reliability, and more efficient energy management. These improvements are helping the solar industry establish solar energy as one of the dominant forces in electricity generation worldwide.
High-Efficiency Solar Panels
One of the most significant advancements in the solar industry has been the development of high-efficiency solar panels. Modern solar modules now achieve far greater energy conversion rates compared to earlier generations of photovoltaic technology. Innovations such as PERC (Passivated Emitter Rear Cell), TOPCon (Tunnel Oxide Passivated Contact), heterojunction cells, and bifacial modules have played a key role in improving the performance of solar panels.
In the early stages of the solar industry, photovoltaic panels typically operated with efficiencies of around 10–12%, meaning that only a limited portion of sunlight could be converted into electricity. However, with continuous technological development, modern solar modules now achieve efficiencies of 20–23% or higher, allowing significantly more electricity to be produced from the same installation area.
Advanced technologies such as TOPCon solar cells have further improved performance, pushing efficiency levels toward 27–28% in laboratory environments. These improvements reduce energy losses within solar modules and increase overall power output. For the solar industry, these advancements are particularly valuable in commercial and industrial solar projects where maximizing electricity generation from limited space is critical. As a result, high-efficiency panels are making solar installations more practical and economically viable for residential, commercial, and utility-scale applications.
Bifacial Solar Technology
Another important technological advancement within the solar industry is the development of bifacial solar panels. Unlike traditional solar modules that generate electricity only from the front side, bifacial panels are designed to capture sunlight from both the front and rear surfaces. This design allows the rear side of the panel to absorb reflected sunlight from the ground or surrounding surfaces, thereby increasing total energy production.
Studies show that bifacial solar panels can generate 10–20% more electricity compared with conventional solar modules, depending on the installation environment and ground reflectivity. Because of this higher energy output, bifacial modules are rapidly becoming a preferred technology for large solar farms and utility-scale solar projects.
The growing adoption of bifacial technology reflects the ongoing innovation within the solar industry, where developers are continuously seeking ways to improve the efficiency and productivity of solar systems. As a result, bifacial solar technology is increasingly becoming a standard component of modern solar power plants worldwide.
Floating Solar Plants
Floating solar systems represent another emerging innovation that is gaining attention within the solar industry. Unlike traditional solar installations that are built on land, floating solar plants are installed on water bodies such as reservoirs, lakes, and dams. This approach allows solar panels to be mounted on floating platforms that remain stable on the water surface. Floating solar technology offers several advantages that make it particularly valuable for countries with limited land availability for large solar installations.
One of the primary benefits is reduced land usage, as floating solar plants utilize water surfaces instead of occupying valuable land resources. This makes it easier for governments and developers within the solar industry to expand renewable energy capacity without competing for agricultural or urban land. Another advantage is higher operational efficiency. The cooling effect provided by water helps maintain lower panel temperatures, which can improve the efficiency of solar modules and increase electricity production.
Floating solar systems also contribute to water conservation, as the solar panels reduce evaporation from reservoirs. This can be particularly beneficial in regions where water scarcity is a concern. Because of these advantages, floating solar technology is becoming an increasingly important solution within the solar industry, especially in countries where land constraints limit the expansion of traditional solar farms.
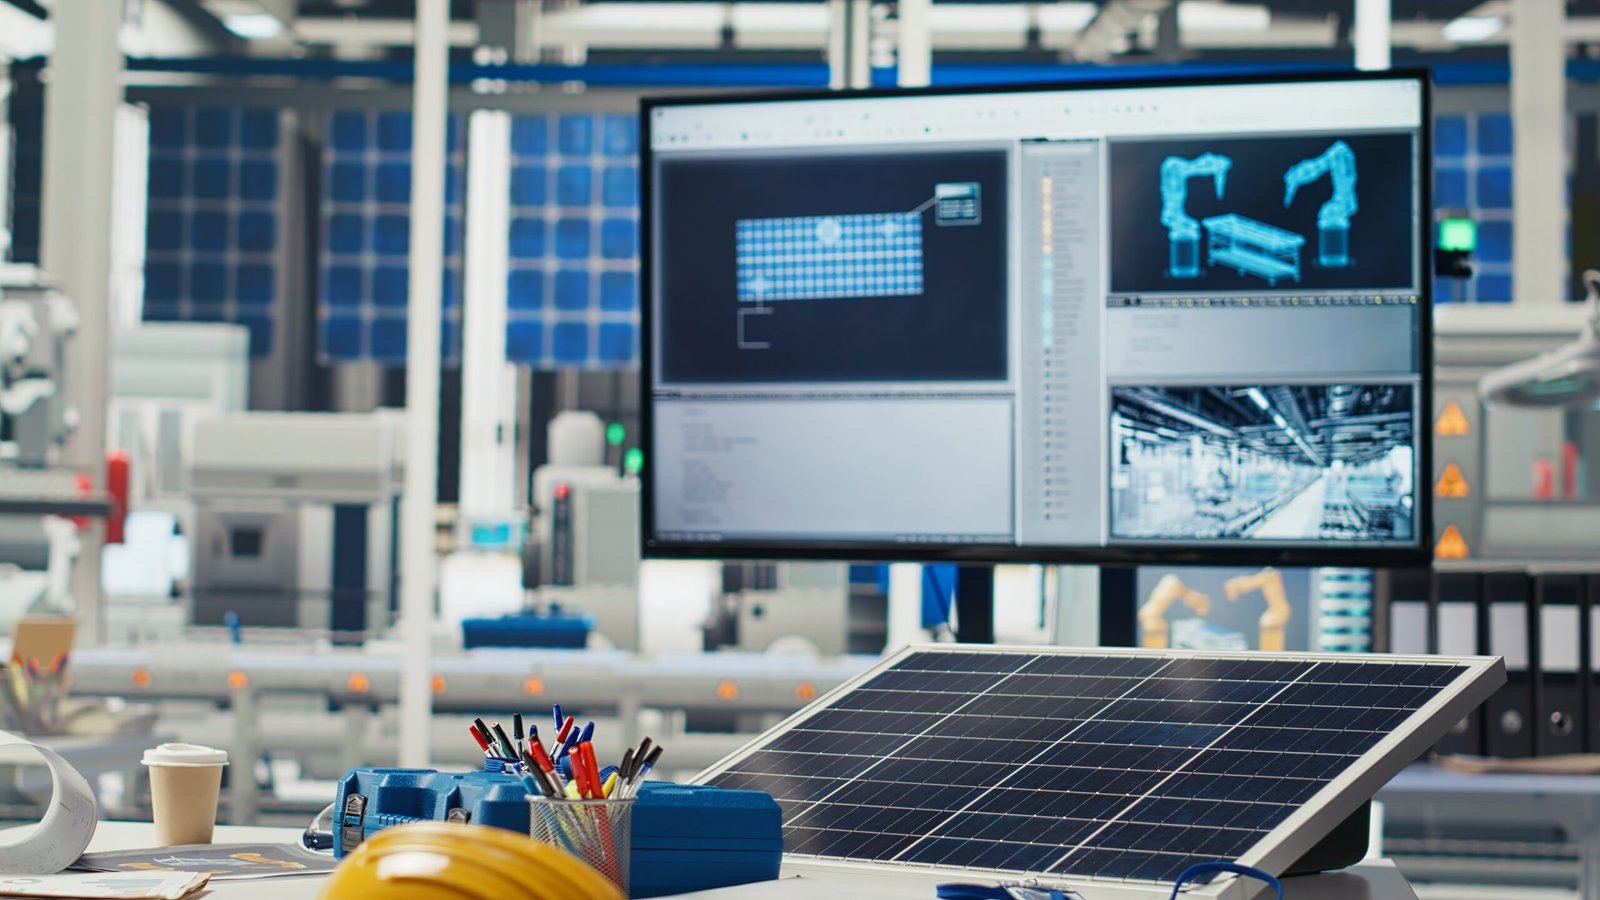
Smart Solar Monitoring
Digital technologies are also transforming the operations of the solar industry through the adoption of smart monitoring systems. Advanced digital tools such as artificial intelligence (AI), Internet of Things (IoT) sensors, and data analytics platforms allow solar power plants to be monitored in real time. These digital monitoring systems provide several operational benefits that are improving the efficiency and reliability of solar projects.
One of the most important advantages is predictive maintenance, which uses data analytics to anticipate equipment failures before they occur. This allows operators to perform maintenance at the right time, preventing costly system breakdowns. Smart monitoring systems also enable the early detection of faults, allowing operators to identify and resolve technical issues quickly. This reduces downtime and improves the overall reliability of solar power plants.
In addition, digital monitoring tools contribute to improved plant efficiency by providing real-time insights into system performance. Operators can analyze performance data to optimize solar generation and ensure that systems operate at maximum efficiency. These systems also support data-driven performance optimization, enabling developers and operators in the solar industry to make informed decisions about energy management, maintenance schedules, and system upgrades. By reducing operational disruptions and maintenance costs, smart monitoring technologies help lower the overall operating expenses of solar facilities.
Challenges Facing the Solar Industry
The solar industry has experienced remarkable expansion over the past decade and has become one of the fastest-growing sectors in the global energy market. Declining solar technology costs, strong government policies, and increasing demand for clean electricity have accelerated the adoption of solar power worldwide. However, despite this rapid growth, the solar industry still faces several challenges that must be addressed to ensure long-term sustainability and large-scale deployment.
These challenges involve a combination of technical, financial, regulatory, and infrastructure-related factors that influence project development, grid integration, and the overall growth of the solar industry. Overcoming these barriers is essential for maintaining the momentum of renewable energy expansion and enabling solar power to play a dominant role in the global electricity system.
Intermittency and Reliability of Solar Power
One of the primary challenges facing the solar industry is the intermittent nature of solar energy, which is reliant on sunlight availability. This leads to peak electricity generation during daylight hours and significantly reduced production at night or in cloudy weather. This variability complicates the provision of a constant electricity supply, necessitating support from energy storage solutions or complementary energy sources to ensure balance between supply and demand. Battery energy storage systems (BESS) are being developed to mitigate this issue; however, large-scale storage infrastructure is still in the process of evolution. Advancements in storage technology will be essential for the future stability and reliability of solar energy systems.
High Initial Investment Costs
Despite a significant reduction in solar panel costs over the last decade, the installation of solar power systems requires a substantial initial investment. These solar projects incur expenses related to equipment purchasing, land acquisition, engineering design, installation, and grid connectivity. Consequently, many businesses and households face financial barriers that hinder the adoption of solar energy. Additionally, the availability of affordable financing poses further challenges in certain regions. To address these issues, various governments and financial institutions have introduced incentives such as tax benefits, subsidies, green financing programs, and long-term power purchase agreements aimed at promoting investment in solar infrastructure.
Grid Integration and Infrastructure Limitations
Another significant challenge for the solar industry is the integration of substantial amounts of solar electricity into existing power grids, which were primarily designed for centralized fossil fuel generation rather than decentralized renewable sources. As solar capacity rises, grid operators encounter issues such as voltage fluctuations, grid congestion, and power curtailment during periods when solar generation exceeds local demand. Addressing these challenges necessitates extensive upgrades to transmission networks and the adoption of smart grid technologies. To foster the ongoing growth of the solar sector, investments in modern grid infrastructure, advanced forecasting systems, and flexible energy management solutions are essential.
Supply Chain Dependencies
The solar industry is currently challenged by global supply chain dependencies that impact the manufacturing of solar panels. Essential materials for solar panel production include polysilicon, silver, aluminum, and glass, which are often sourced from specific regions around the globe. Consequently, any disruptions in the supply chain—stemming from geopolitical tensions, trade restrictions, or shortages of raw materials—can significantly affect the availability and pricing of solar components. These disruptions not only elevate project costs but also lead to delays in solar installations. To combat these vulnerabilities and enhance supply chain resilience, various countries are investing in domestic solar manufacturing capabilities, promoting local production of photovoltaic modules and components within the industry.
Land Use and Environmental Concerns
Utility-scale solar projects necessitate substantial land for installation, posing challenges in areas with limited land or competing uses like agriculture and urban development. Environmental factors are critical in solar project development, as large solar installations may impact ecosystems, wildlife habitats, and local landscapes without adequate management. To mitigate these issues, the solar industry is increasingly embracing alternative approaches, including rooftop solar systems, floating solar plants, and agrivoltaic systems that integrate solar energy production with agricultural practices.
Energy Storage Limitations
Energy storage is a critical challenge within the solar industry, primarily due to the variability in solar energy generation throughout the day. Reliable storage systems are essential for capturing excess electricity produced during peak sunlight hours and utilizing it when demand increases. Recent advances in battery storage technologies have enhanced performance; however, the cost of large-scale storage systems remains high. Ongoing innovation and investment are necessary to enhance the efficiency, lifespan, and affordability of these energy storage solutions. As technology continues to evolve, improved storage systems will be pivotal in enabling solar energy to supply consistent, round-the-clock electricity.
Policy and Regulatory Uncertainty
Government policies and regulatory frameworks are pivotal in shaping the solar industry’s growth and development. Supportive policies, including renewable energy targets, tax incentives, and subsidy programs, significantly boost solar adoption globally. Nonetheless, challenges such as abrupt policy shifts, regulatory delays, and complicated approval processes can introduce unpredictability for solar developers and investors. An unstable policy environment has the potential to hinder project advancement and deter investment in solar infrastructure. Therefore, it is crucial to establish clear and consistent policy frameworks to bolster investor confidence and facilitate the sustainable expansion of the solar sector.
Workforce and Skill Shortages
As the solar industry experiences rapid growth, there is a corresponding increase in the demand for skilled professionals, particularly in the areas of solar engineering, installation, and maintenance. This surge in demand highlights a critical issue: the existing shortage of trained technicians and engineers, which poses a significant risk to project development timelines and overall operational efficiency within the sector.
To counter this challenge and sustain the industry’s upward trajectory, it is imperative to expand technical education programs and implement comprehensive training initiatives. Workforce development efforts are essential to ensure the availability of a sufficiently skilled labor pool capable of supporting the future growth of the solar industry.
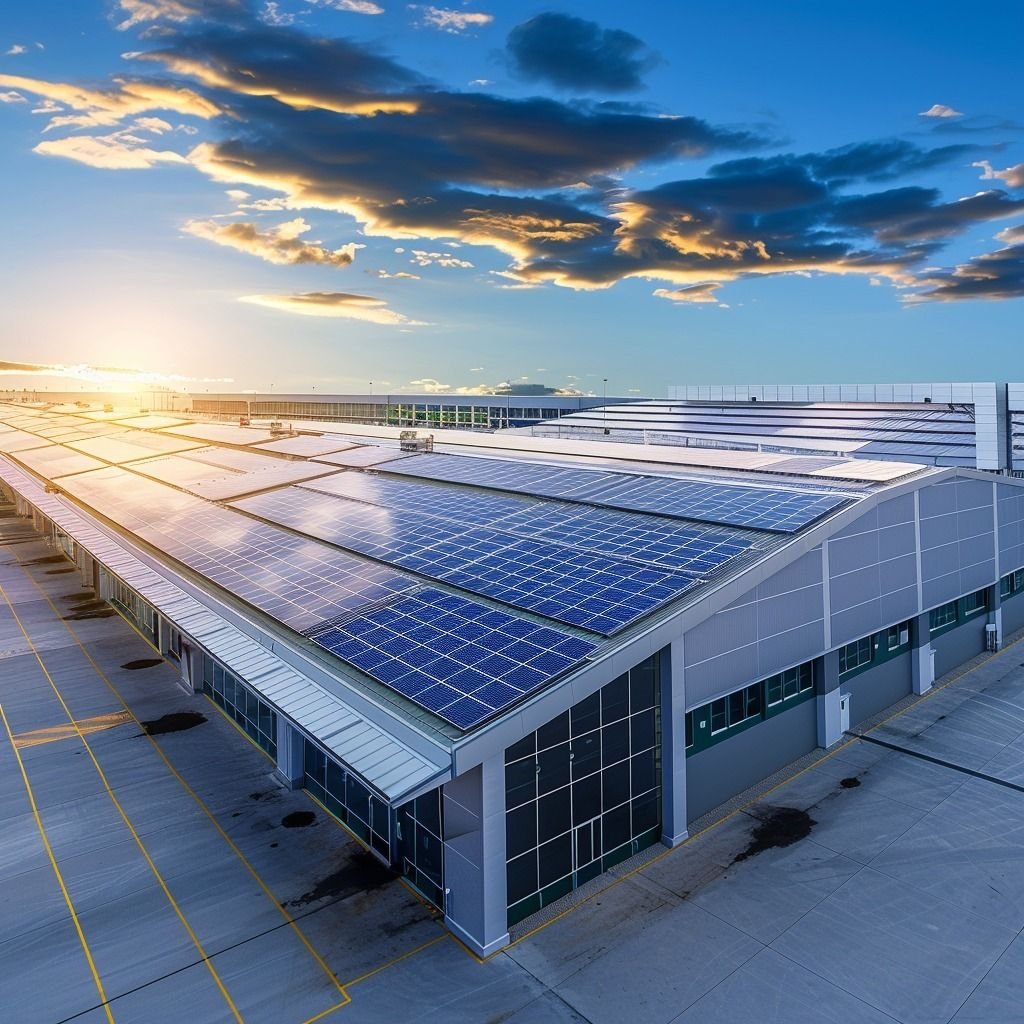
Solar Energy and Industrial Sustainability
The global shift toward renewable energy has made sustainability a key priority for industries across the world. Rising electricity demand, increasing environmental regulations, and growing pressure to reduce greenhouse-gas emissions are encouraging businesses to adopt cleaner and more efficient energy solutions. In this transformation, solar power has emerged as one of the most effective technologies for supporting industrial sustainability while maintaining operational efficiency and economic growth.
The solar industry plays a crucial role in helping industries transition toward sustainable energy systems. By integrating solar energy into manufacturing facilities, warehouses, and industrial complexes, businesses can reduce their dependence on fossil fuels and significantly lower their environmental impact. Solar power not only supports sustainability goals but also improves energy efficiency, operational stability, and long-term cost management.
Reducing Carbon Emissions in Industrial Operations
Industrial activities are significant contributors to global carbon emissions, primarily due to their reliance on fossil fuel-based electricity. The shift to solar energy offers industries a clean and renewable alternative, enabling them to minimize greenhouse gas emissions. Solar power systems operate without emitting carbon dioxide or other pollutants, allowing businesses to substantially reduce their carbon footprint and align with global climate objectives. This transition is increasingly critical as governments implement stricter environmental regulations, and industries pledge to achieve carbon-neutral operations. Consequently, the solar industry is emerging as a vital collaborator in assisting businesses to meet sustainability goals while ensuring reliable energy supply.
Lower Energy Costs and Long-Term Financial Benefits
Energy costs constitute a substantial portion of operational expenses across various industries. The adoption of solar energy serves as a financially viable alternative, enabling companies to generate their own electricity and diminish dependence on grid power. Following the installation of a solar system, the cost of electricity generation stabilizes, as it is not subject to the fluctuations associated with fuel prices. This stability empowers industries to shield themselves from the variability inherent in electricity tariffs and the broader energy market.
Moreover, industrial solar installations often recoup their initial investments within a relatively short time frame, typically spanning a few years. Once the payback period is achieved, these solar systems are capable of generating electricity for decades, thus providing enduring financial benefits and contributing to a reduction in overall energy expenditures. The long-term advantages of solar energy underscore its role as a strategic investment for industries aiming to manage energy costs effectively.
Improving Energy Security and Operational Stability
Reliable electricity supply is crucial for industrial productivity, as power outages or fluctuations can disrupt processes and incur financial losses. Solar energy systems offer industries the ability to generate electricity on-site, enhancing energy independence and reducing reliance on external power. Rooftop solar installations and captive solar plants can secure a stable electricity supply for operations. Furthermore, integrating solar energy with battery storage systems provides backup power during grid disruptions, enhancing operational reliability and enabling continuous production.
Supporting Corporate Sustainability and ESG Goals
Sustainability has emerged as a pivotal element in contemporary corporate strategies, with many firms implementing Environmental, Social, and Governance (ESG) frameworks aimed at reducing emissions, enhancing energy efficiency, and investing in renewable energy sources. Solar energy is particularly crucial for companies striving to meet these sustainability objectives, as it showcases their dedication to environmental stewardship and sustainable development. Furthermore, businesses that invest in renewable energy often enhance their brand reputation, appeal to eco-conscious consumers, and foster better relationships with investors and stakeholders. Consequently, the solar power sector is increasingly recognized as a vital ally in the transition towards sustainable business practices.
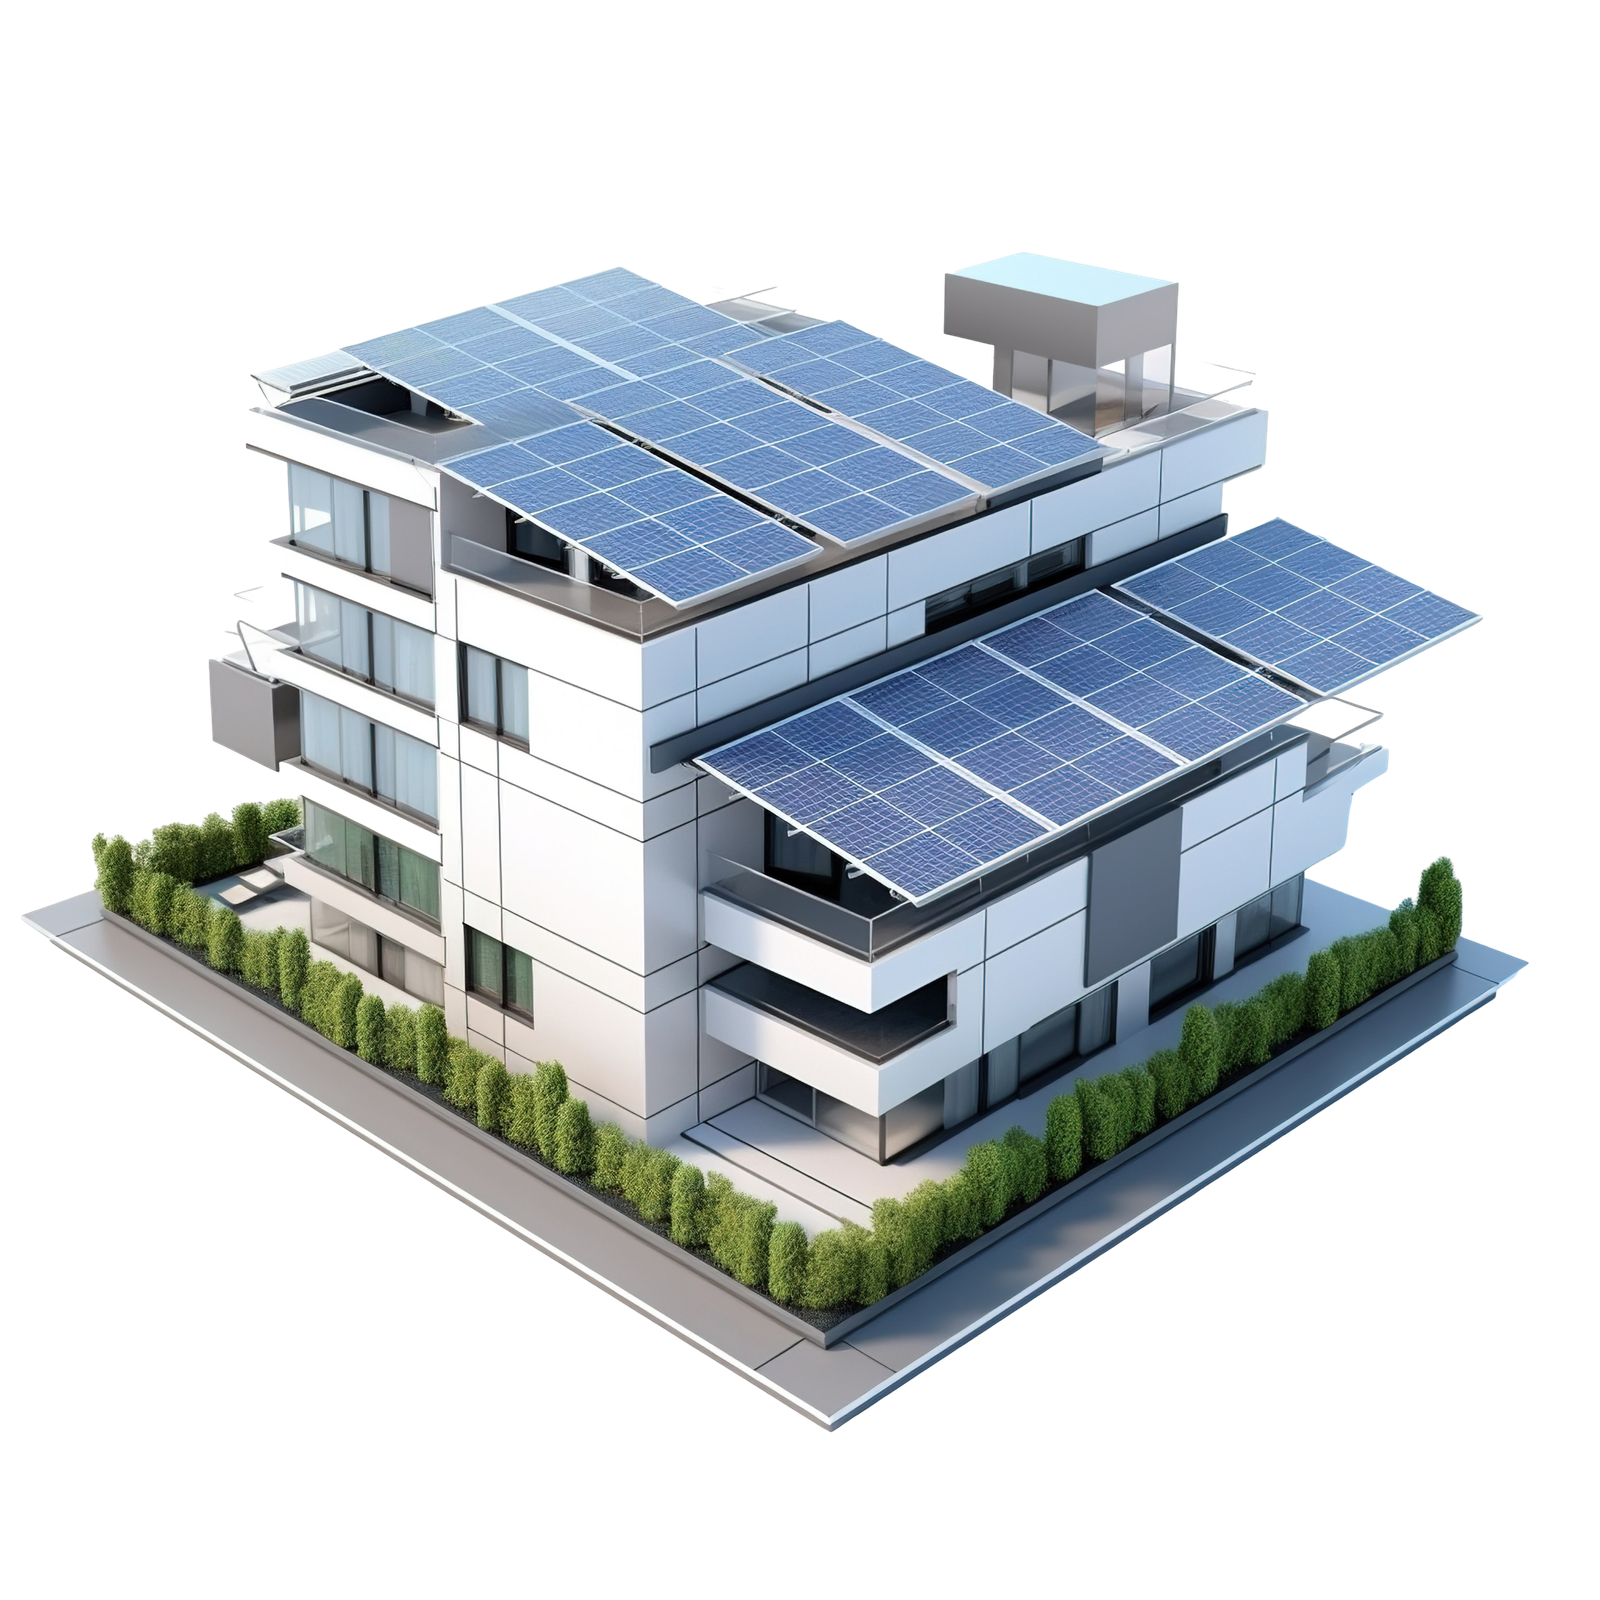
Flexible Solar Solutions for Industrial Applications
The solar industry offers various deployment models tailored for industrial needs and resources, including:
- Rooftop Solar Systems: Installation of solar panels on factory and warehouse rooftops for on-site electricity generation.
- Ground-Mounted Solar Plants: Establishment of solar farms on unused industrial land to supply power directly to manufacturing facilities.
- Solar Carports: Solar panels set up over parking areas, generating energy and providing shaded parking.
- Floating Solar Plants: Solar systems placed on reservoirs or water bodies, enabling power generation without additional land use.
These adaptable solutions facilitate the integration of renewable energy into industrial operations while maximizing land and infrastructure efficiency.
Contribution to Sustainable Industrial Development
The adoption of solar energy serves both individual businesses and the broader goals of economic and environmental sustainability. Renewable energy initiatives generate job opportunities, foster technological advancements, and help achieve national clean-energy objectives. As industries integrate solar power, they build sustainable industrial ecosystems that focus on efficient resource usage, minimized emissions, and enduring environmental conservation. Consequently, the ongoing expansion of the solar sector is pivotal for promoting sustainable industrial development and enhancing the operational efficiency and accountability of businesses.
The Future of Solar Industry
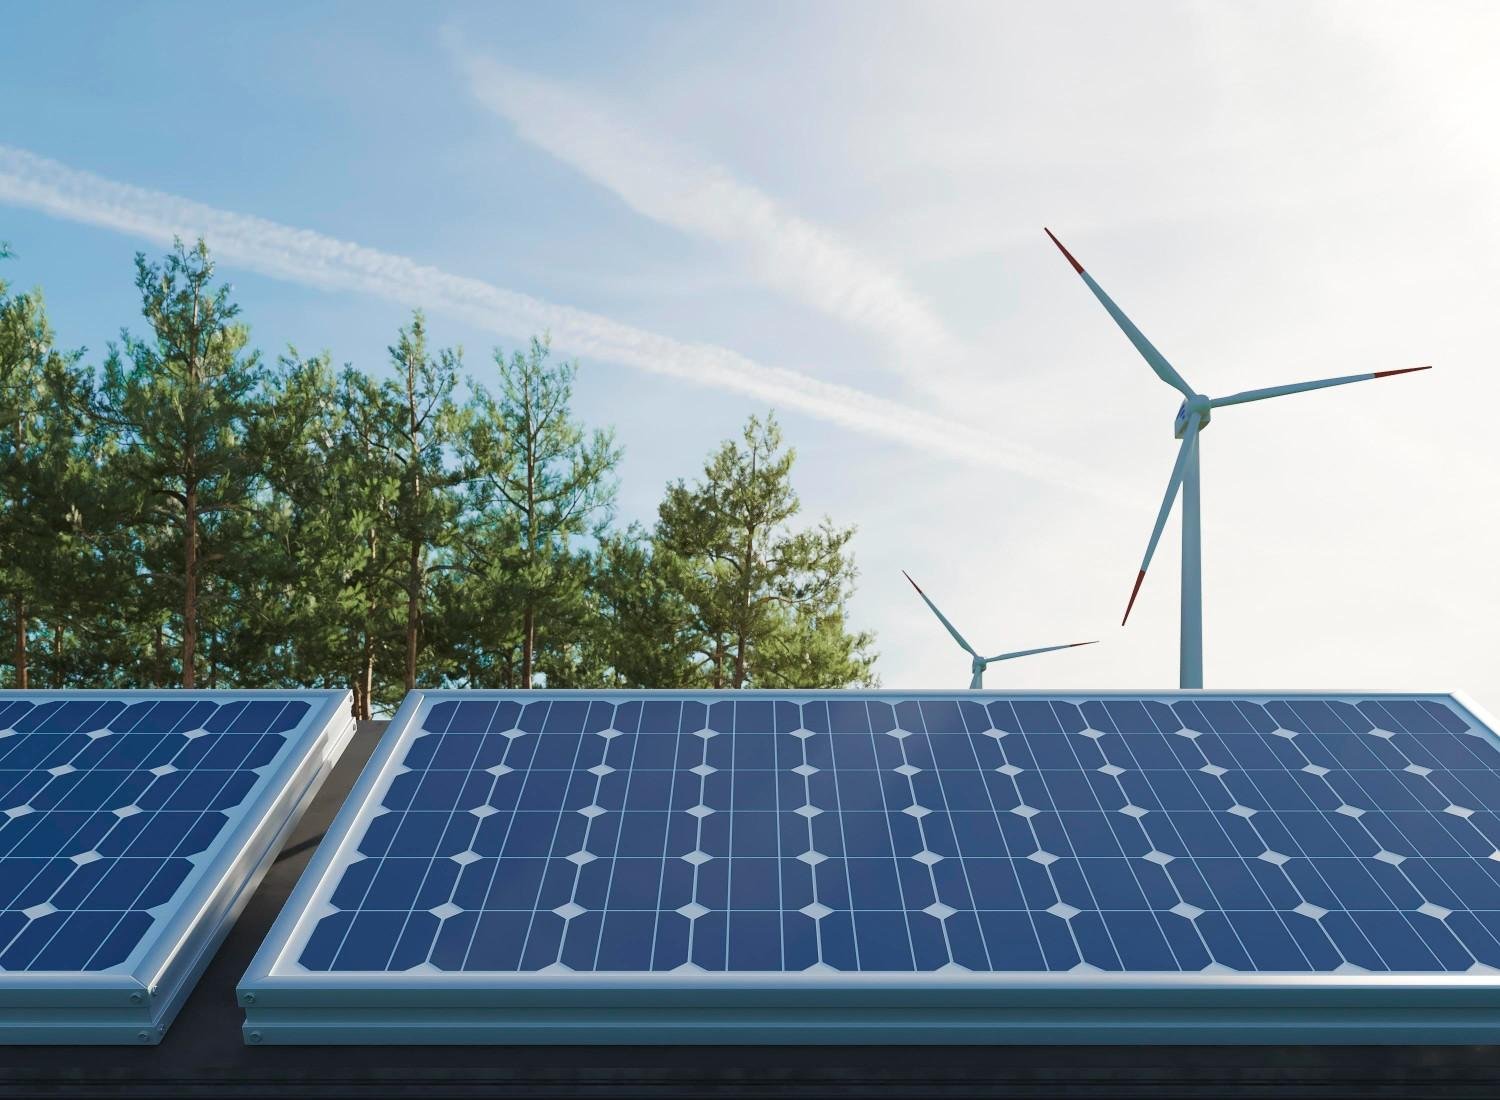
The solar industry is poised for significant growth as the world shifts towards clean energy. Over the past decade, solar energy has developed from a niche technology to a major electricity source, driven by decreasing costs, favorable policies, and heightened environmental consciousness. Solar power is expected to be crucial in meeting net-zero carbon targets, with large-scale parks and rooftop installations enhancing its contribution. Technological advancements, such as improved photovoltaic efficiencies and energy storage solutions, are making solar more competitive.
The emergence of hybrid renewable systems combining solar, wind, and battery storage offers stability in power generation, while digital tools enhance operational efficiency. Emerging markets in Asia, Africa, and Latin America are investing in solar infrastructure to address rising energy demands. Moreover, solar power supports green hydrogen production, presenting new growth avenues. Overall, the future of the solar sector hinges on innovation and global demand for sustainable electricity, solidifying its role in the energy landscape and supporting economic and environmental goals.
Conclusion
The solar industry has emerged as one of the most powerful drivers of the global clean energy transition. Rapid technological advancements, declining installation costs, supportive government policies, and increasing environmental awareness have significantly accelerated the adoption of solar energy worldwide. From utility-scale solar farms to industrial rooftop installations and innovative solutions like floating solar and solar-plus-storage systems, the industry continues to expand across multiple sectors and markets.
As businesses, industries, and governments move toward sustainable energy solutions, the role of the solar industry will become even more critical. Solar energy not only reduces carbon emissions but also provides long-term economic benefits by lowering electricity costs and improving energy security. With continuous innovation and growing investment opportunities, solar power is set to become a cornerstone of the future global energy system. Ultimately, the continued growth of the solar industry will help create a cleaner, more resilient, and sustainable energy landscape for future generations.
As the solar industry continues to transform the global energy landscape, businesses and industries have an opportunity to lead the transition toward sustainable power. Investing in solar energy today not only reduces operational costs but also strengthens long-term energy security and environmental responsibility. If your organization is exploring solar solutions or planning to transition toward renewable energy, connect with experienced solar experts to unlock the full potential of solar power and build a cleaner, more sustainable energy future.