Overview
What is a Commercial PPA Investment?
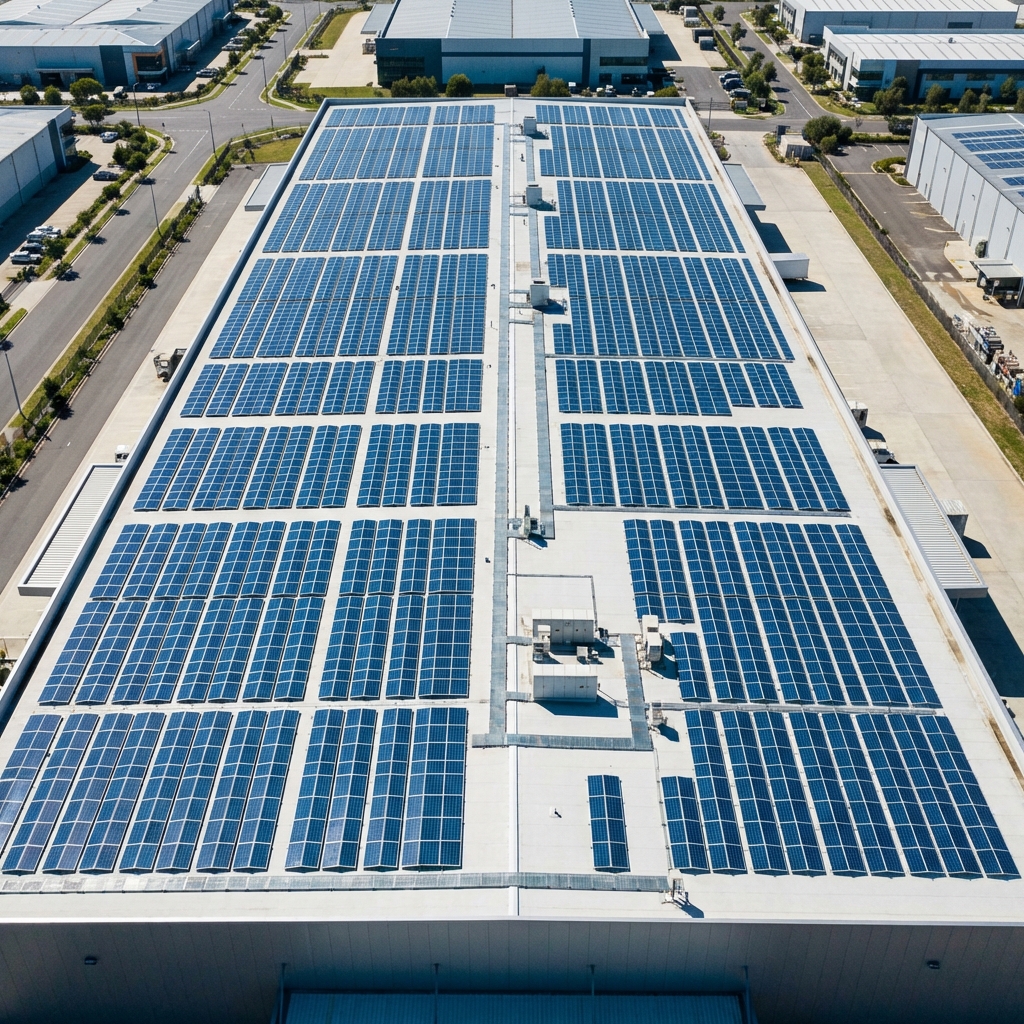
Commercial PPA investments involve equity participation in solar projects that sell power to corporate and industrial (C&I) consumers under long-term Power Purchase Agreements.
Unlike utility/DISCOM projects that rely on state government creditworthiness, commercial PPAs depend on private sector offtaker credit quality. This creates both higher returns (to compensate for credit risk) and the need for robust payment security structures.
Why Higher Returns?
C&I tariffs are negotiated freely (not regulated auctions), allowing developers to price in risk premium. Combined with shorter PPA tenures (15-20 years vs 25 years for utilities), this results in higher IRRs for investors.
Structure
Typical Deal Parameters
| PPA Tenure | 15-25 years |
| Tariff Structure | Fixed / Escalating (2-3% p.a.) |
| Typical Project Size | 5-50 MW |
| Minimum Offtake | 70-80% of scheduled energy |
| D:E Ratio | 70:30 typical |
| Cost of Debt | 10-11% p.a. |
| Equity Investment | ₹1.2-1.5 Cr/MW |
| Total Capex | ₹4-5 Cr/MW |
Counterparty
Target Offtaker Segments
| Segment | Examples | Credit Quality |
|---|---|---|
| Manufacturing | Auto OEMs, steel, cement, chemicals, FMCG | AA to BBB |
| IT/ITES | Data centers, tech parks, BPO campuses | AAA to AA |
| Retail/Commercial | Malls, warehouses, hotel chains | AA to BBB |
| Textiles | Spinning mills, garment units, processing | A to BBB |
| Pharma | API units, formulation, bulk drug | AA to A |
We focus on investment-grade or near-investment-grade offtakers with demonstrated payment capacity.
Return Security
Multi-Layer Payment Security
Letter of Credit
2-3 months billing
Irrevocable, confirmed LC from scheduled commercial bank. First line of defense.
Bank Guarantee
3-6 months billing
Performance guarantee from scheduled bank. Invoked if LC lapses.
Escrow Account
Revenue waterfall
Dedicated escrow for energy payments, routed before other creditors.
Parent Guarantee
Full PPA value
Corporate guarantee from parent company for group entities.
Risk Management
Comprehensive Risk Mitigation
| Risk | Mitigant |
|---|---|
| Offtaker Default | Credit screening, payment security, termination payments |
| Tariff Renegotiation | MFN clause, arbitration provision, change-in-law protection |
| Volume Risk | Take-or-pay clause, deemed generation for curtailment |
| Technology Risk | Tier-1 equipment, EPC guarantees, insurance coverage |
| O&M Risk | Performance guarantees, availability commitments, cost caps |
| Regulatory Risk | Charge pass-through provisions, regulatory change protection |
Illustrative
Sample Project Economics
20 MWp Ground-Mounted Project with C&I Offtaker
| Project Capacity | 20 MWp |
| Total Capex | ₹90 Cr |
| Equity Required | ₹27 Cr (30%) |
| Debt | ₹63 Cr (70%) |
| PPA Tariff Year 1 | ₹4.20/kWh |
| Escalation | 2% p.a. |
| CUF Assumption | 23% |
| Annual Generation | 40.3 MU |
| Year 1 Revenue | ₹16.9 Cr |
| Project IRR | 13.5% |
| Equity IRR | 18.2% |
| DSCR Average | 1.42x |
| Equity Payback | 5.3 years |
*Illustrative. Actual returns depend on project specifics, tariff, location, and financing terms.
Institutional Standards
Due Diligence Package
Technical
- Independent Engineer report
- P50/P90 energy yield
- Grid connectivity study
- Technology assessment
Legal
- PPA review and opinion
- Land title search (30 years)
- Permit status verification
- Corporate documentation
Financial
- Auditable financial model
- Sensitivity analysis
- Scenario modeling
- Tax structuring review
Commercial
- Offtaker credit assessment
- Payment security review
- Contract benchmarking
- Counterparty DD
Process
Investment Journey
Deal Sourcing
Ongoing
Access to proprietary pipeline of C&I projects
Initial Screening
1-2 weeks
Offtaker credit, PPA terms, project viability
Due Diligence
4-6 weeks
Complete technical, legal, financial DD
Investment Committee
1-2 weeks
Presentation, approval, terms finalization
Documentation
2-4 weeks
SHA, subscription, financing documents
Disbursement
Per schedule
Equity injection per milestone schedule
Liquidity
Exit Pathways
| Timing | Exit Route | Value Driver |
|---|---|---|
| Post-COD (0-12m) | Sale to infra funds | Premium for stabilized asset |
| Operations (1-3y) | Secondary market sale | Based on track record |
| Mid-life (3-5y) | Refinancing + partial exit | Leverage optimization |
| Mature (5y+) | Yield investor sale | Premium for proven cash flows |