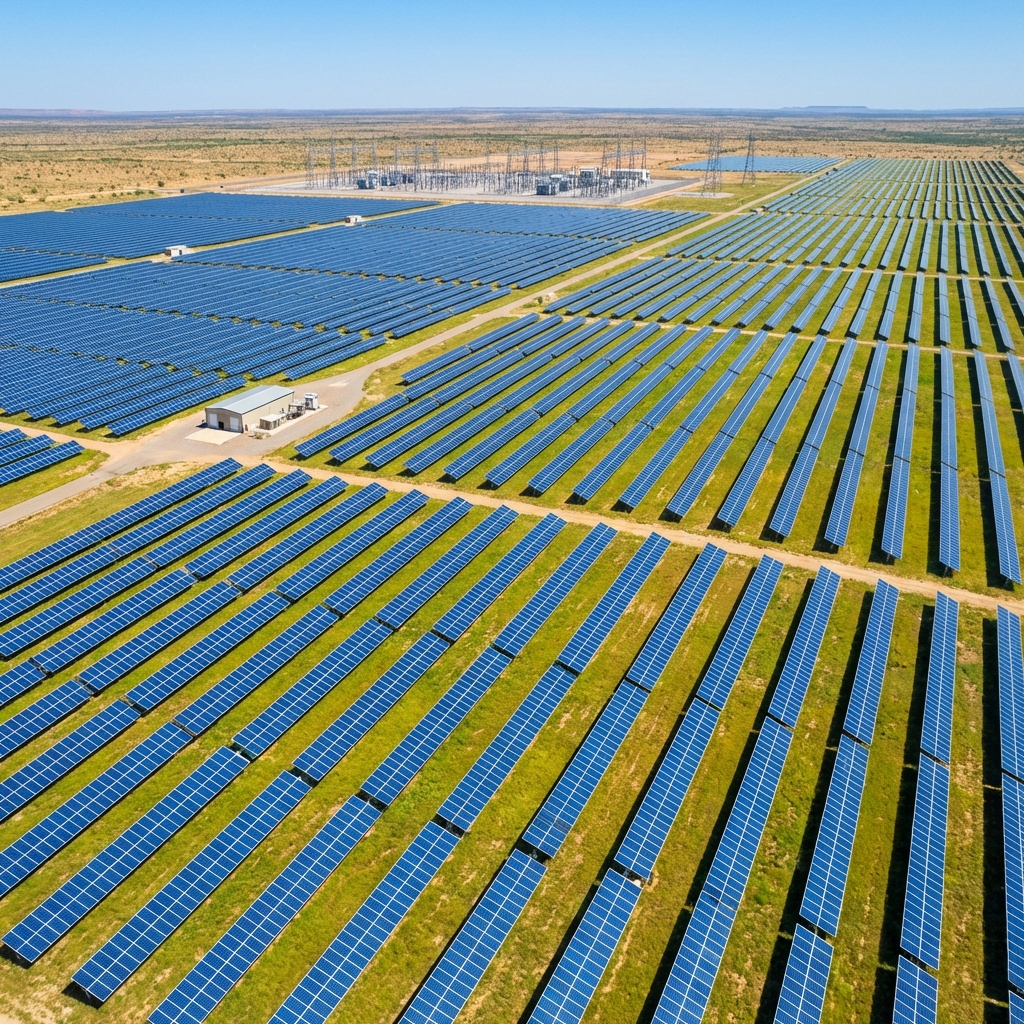
Utility Scale Solar Park
50+ MW Installation
Pooling Substation
Grid Connectivity
The Power Park Model
Shared Infrastructure = Lower Costs
A solar park hosts multiple independent projects separated by fencing, but sharing critical infrastructure. This model delivers significant cost advantages over standalone utility-scale plants.
Pooling Substation
Shared 33/66/110 kV
Evacuation Line
Shared HT Line
Security
Shared Perimeter
Water Supply
Common Source
O&M Team
Shared Maintenance
Bulk Land
Volume Discount
Solar Park vs Standalone Utility Plant
| Parameter | Solar Park (Shared) | Standalone Plant |
|---|---|---|
| Land Cost | Lower (bulk deal) | Higher (individual) |
| Substation Cost | Shared across projects | 100% borne by project |
| Transmission Line | Shared evacuation | Dedicated line needed |
| Security & Fencing | Perimeter shared | Full boundary cost |
| O&M Cost | Economies of scale | Higher per MW |
| Material Transport | Bulk logistics | Project-specific |
| Typical Tariff Impact | 10-15% lower | Baseline |
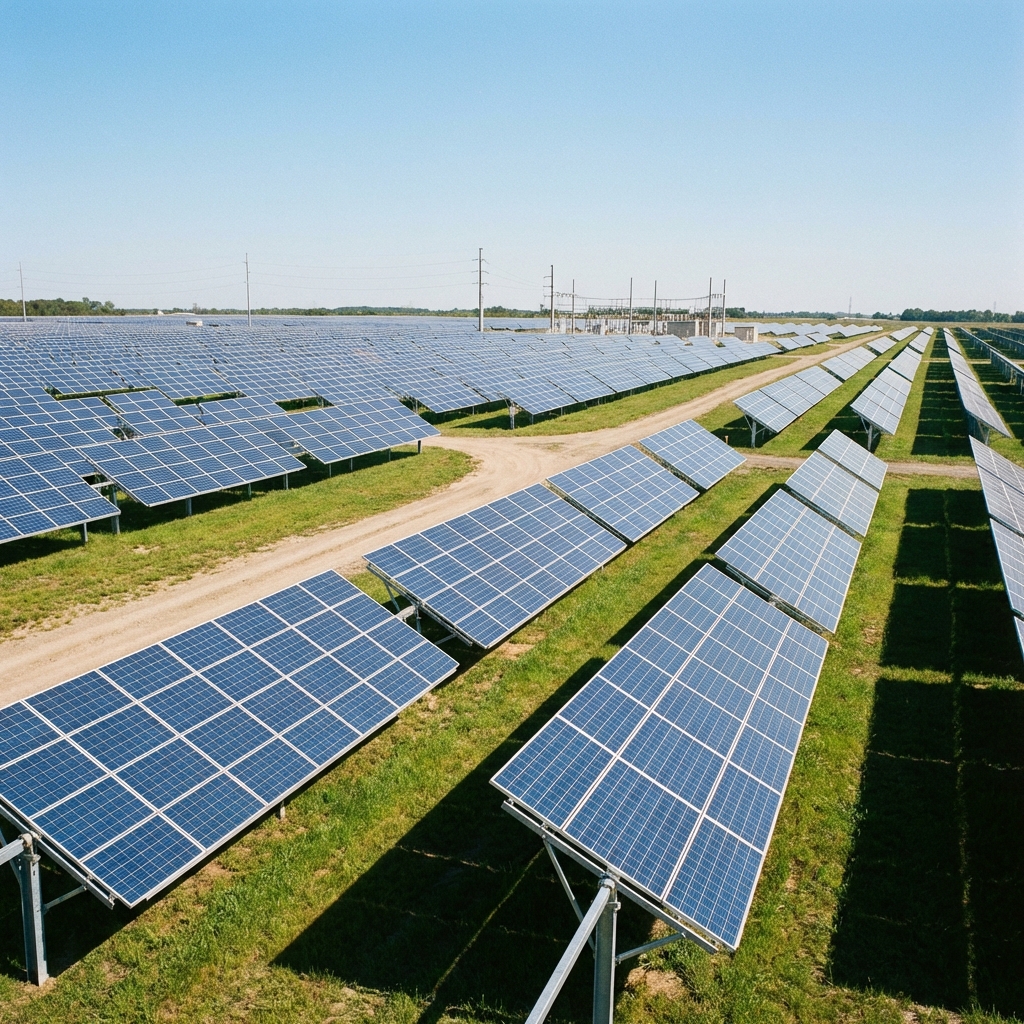
Typical Solar Park Layout
Project A
20 MW
Project B
15 MW
Project C
25 MW
Project D
10 MW
Shared Pooling Substation
33/110 kV
Each project has its own fenced area within the park, but shares common infrastructure
The Concept
What is Offsite Solar?
Offsite solar means sourcing renewable power from a solar plant located away from your consumption site. The power is wheeled through the state grid using open access regulations.
How It Works
Solar park generates electricity at remote location (e.g., Rajasthan, Gujarat)
Power injected into state grid via pooling substation
Wheeled through transmission network to your location
You draw equivalent power from grid, offset against generation
Onsite vs Offsite Solar
| Aspect | Onsite | Offsite |
|---|---|---|
| Location | Your premises | Remote |
| Scale | kW to low MW | MW to GW |
| Grid Dependency | Minimal | Full |
| Open Access | Not required | Required |
| Space Needed | Yes | No |
Infrastructure
Solar Park Components
Solar Park
Generation
Inverter & Transformer
Conversion
Pooling Substation
Grid Injection
Transmission
Wheeling
Your Factory
Consumption
Solar PV Modules
High-efficiency bifacial modules, 540-700W capacity.
Mounting Structure
Fixed tilt or tracker systems optimized for land.
Inverters
Central or string inverters with SCADA integration.
Pooling Substation
Step-up transformers and HT switchgear.
Transmission Line
Dedicated or shared transmission to grid substation.
SCADA & Monitoring
Real-time performance monitoring and dispatch.
Advantages
Benefits of Solar Park Power
Utility Scale Power
Access MW-scale clean energy without land or infrastructure constraints at your site.
Long-Term PPA
Lock in fixed electricity rates for 15-25 years, protecting against tariff escalation.
RE100 Compliance
Meet renewable energy commitments and sustainability goals with verified green power.
Zero CapEx
No upfront investment required. Pay only for the power you consume at agreed rates.
Tariff Hedge
Protect against rising grid electricity costs with fixed or predictable escalation.
Green Certificates
Receive RECs and carbon credits for your sustainability reporting and ESG compliance.
Business Models
Open Access Procurement Models
Choose the right model based on your investment appetite, consumption scale, and savings target.
Third Party PPA
Developer Owned
Developer builds and operates the plant. You buy power at fixed tariff via open access.
- Zero CapEx for offtaker
- Fixed tariff 15-25 years
- Developer manages plant
- Open access charges apply
Best for: Most enterprises
Group Captive
26% Equity Model
Offtaker invests 26% equity in SPV. Exemption from cross-subsidy and additional surcharge.
- Lower tariff
- CSS/AS exemption
- Equity investment required
- 51% consumption quota
Best for: Large industrials
Captive Plant
100% Owned
Own and operate your dedicated solar park. Full control over asset and generation.
- Complete ownership
- Maximum savings
- Asset on books
- Full responsibility
Best for: Large conglomerates
Open Access Charges Breakdown
| Component | Description | Typical Range |
|---|---|---|
| Wheeling Charges | Transmission network usage fee | ₹0.20-0.50/kWh |
| Cross Subsidy Surcharge (CSS) | Subsidy compensation to DISCOM | ₹0.50-1.50/kWh* |
| Additional Surcharge (AS) | Stranded capacity compensation | ₹0.20-0.80/kWh* |
| Transmission Losses | Energy lost in transmission | 3-5% |
| Scheduling Charges | SLDC scheduling and UI charges | ₹0.05-0.15/kWh |
* Exempted or reduced in Group Captive model. Rates vary by state.
State-Wise Analysis
Open Access Ecosystem by State
| State | CSS Level | AS Level | Solar Potential | Notes |
|---|---|---|---|---|
| Rajasthan | High (₹1.20) | Low | Excellent | Top solar destination |
| Gujarat | Medium | Medium | Excellent | Strong policy support |
| Karnataka | Low | Low | Good | Favorable for open access |
| Maharashtra | High | High | Good | Large demand center |
| Tamil Nadu | Medium | Low | Very Good | Strong RE ecosystem |
| Andhra Pradesh | Low | Low | Very Good | Favorable tariffs |
How It Works
Solar Park Procurement Process
Requirement Study
Load analysis, location, consumption pattern
Source Selection
Park identification, tariff negotiation
Regulatory Approval
Open access, SLDC, connectivity approvals
PPA & Agreements
Power purchase, banking, wheeling
Commissioning
Plant COD, metering, synchronization
Power Supply
Scheduling, billing, monitoring